Kay Statistics and Usage
This page shows the usage and statistics for the Kay cluster. Data presented will be updated every quarter of the year.
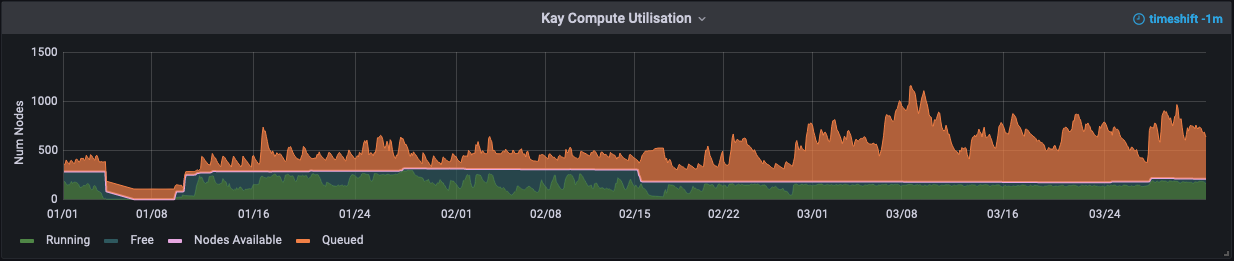
Kay Nodes Utilisation
Kay utilisation since the start of the year up to the last quarter.
- Green: Jobs running
- Orange: Jobs queueing
- Blue: Free nodes
- Pink: Nodes available
 |
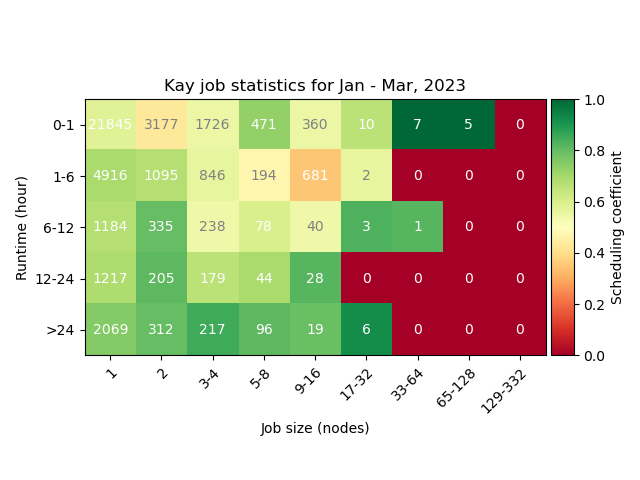
Queueing Times & Scheduling Coefficients
The heatmaps below provide information on the mean queue times on Kay over the last quarter (left hand panel) and since the start of the year up to the last quarter (right hand panel) for different job sizes/lengths. Colour scheme bar (right) in the heatmap indicates the mean queue time as measured by scheduling coefficient for each class. Number within each box corresponds to the number of jobs of that class.
The scheduling coefficient defined as the ratio of run time to run time plus queue time. It represents the fraction of the time in the queue that was spent running. For example, a value of 1 indicates that the job started instantaneously while 0.5 indicates that the job was in the queue waiting for the same amount of time that it ran for.
 |
|
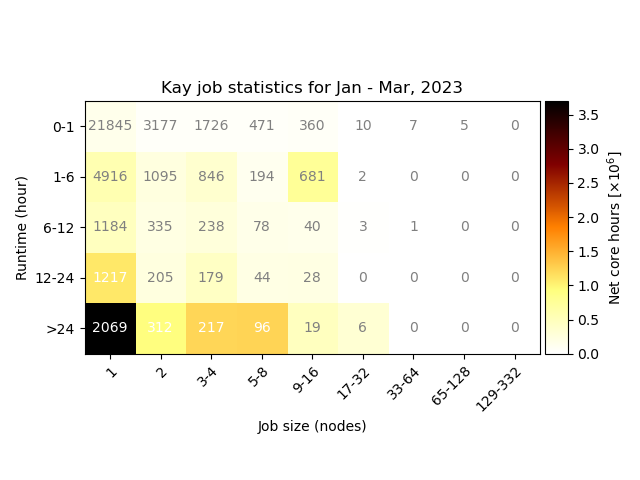
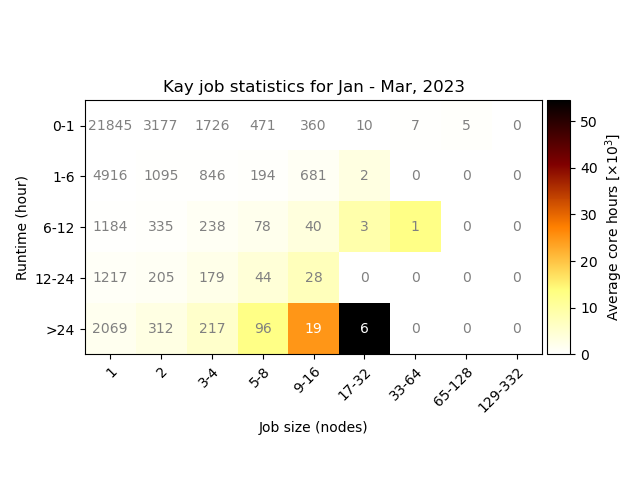
Job Allocation Statistics
The usage of Kay over the last quarter (left hand panel) and since the start of the year up to the last quarter (right hand panel) for different job sizes. for different job size (nodes) and walltime (hours) is provided by the following heatmap where the colour indicates the net core hours spent for each class. The number shown in each box is the number of jobs for that class.
 |
|
The usage of Kay over the last quarter (left hand panel) and since the start of the year up to the last quarter (right hand panel) for different job sizes. for different job size (nodes) and walltime (hours) is provided by the following heatmap where the colour indicates the average core hours spent for each class. The number shown in each box is the number of jobs for that class.
 |
|
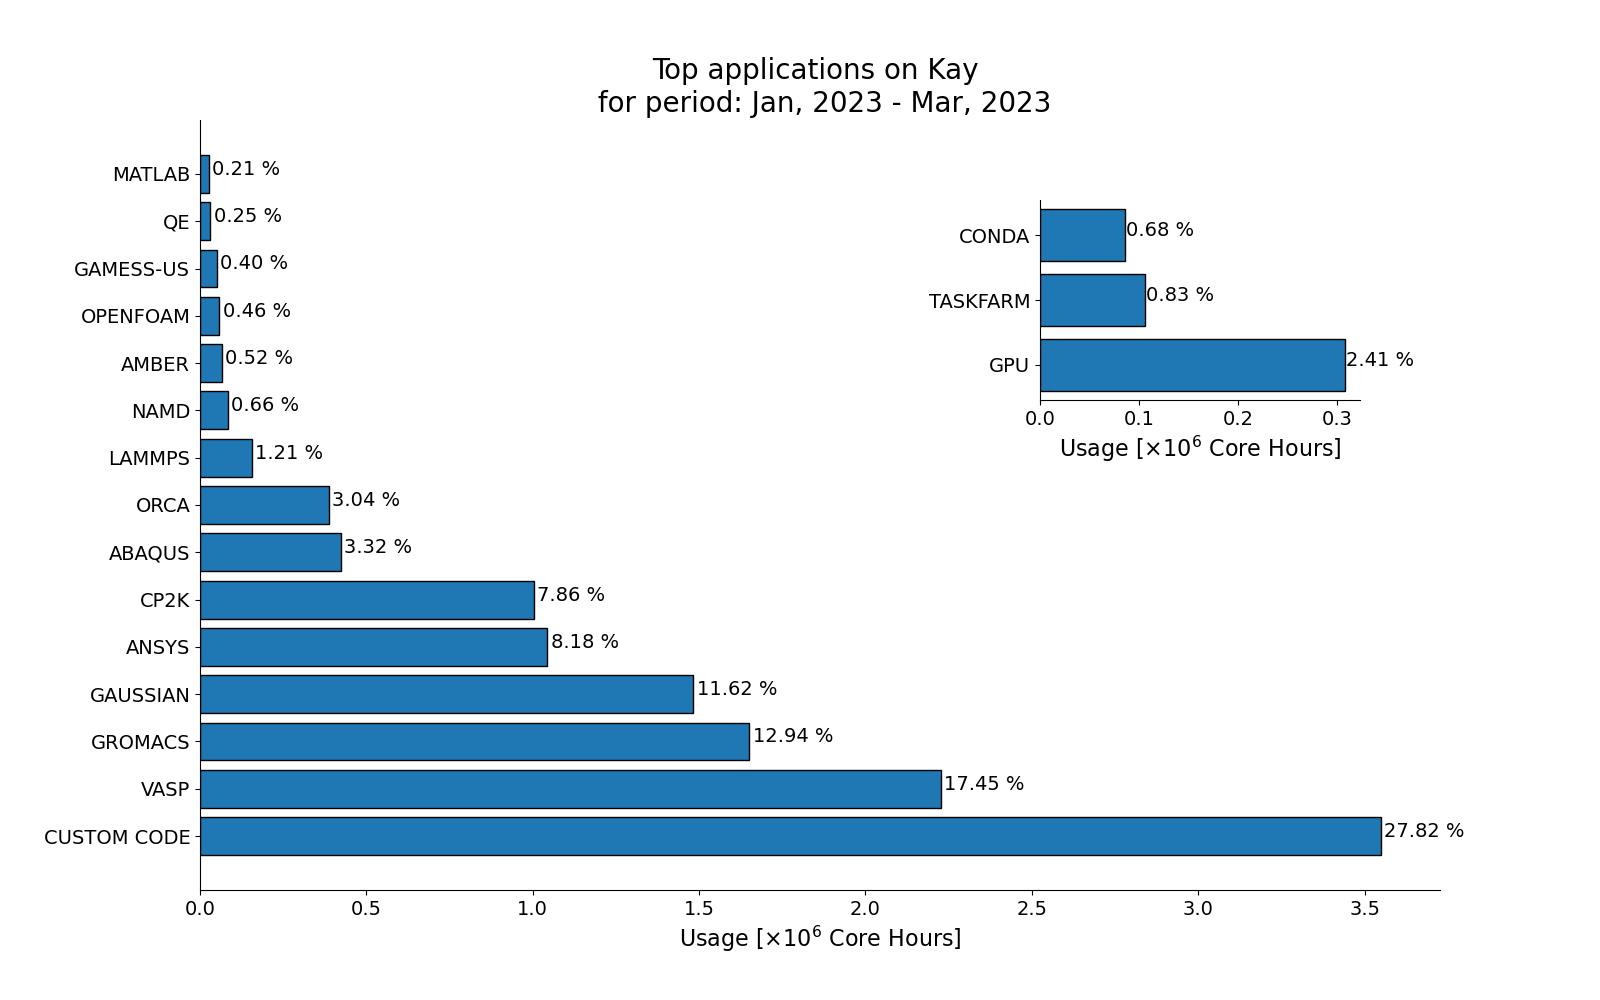
Software usage
The software usage of Kay over the last quarter (top panel) and since the start of the year up to the last quarter (Bottom panel) in core hours. In-plots correspond to the percentage of the core hours used by singularity containers, conda environments, GPUs and taskfarm.
 |
|
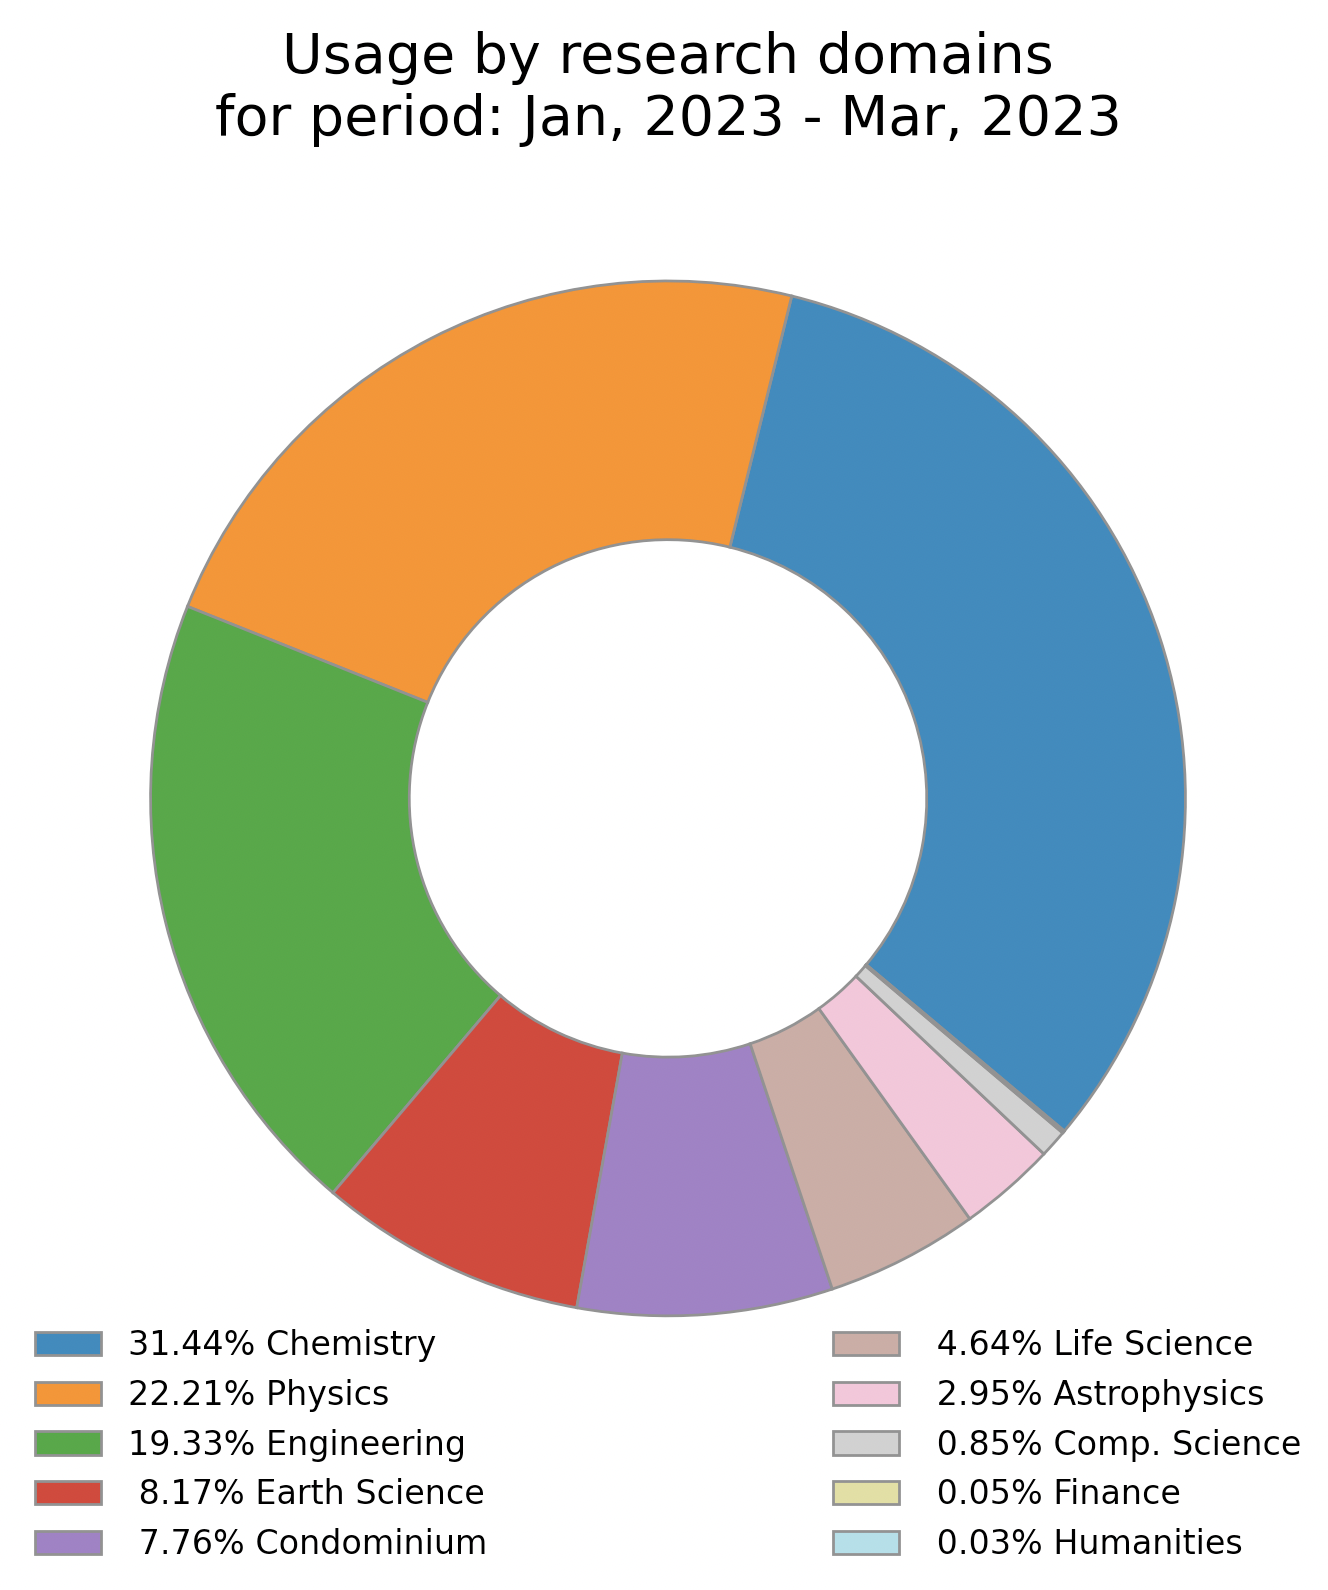
Domain Usage
Usage of Kay with respect to the scientific domain since the start of the year up to the last quarter (right hand panel) in percentage of the total core hours.