
Maxima of Minima: better get used to those orange heat warnings!
Last Tuesday, 20th July 2021 Met Éireann issued its first ever status orange high temperature warning, a big part of which was that night-time temperatures would not drop below 20°C in places. This is probably the first time most of us have had to even think about uncomfortably high minimum daily temperatures, at least in Ireland. It’s the daily maximum temperatures that get all the attention – even if they aren’t necessarily the ones setting the most records. However, insofar as the climate greenhouse effect works like a real greenhouse (to trap outgoing long-wave radiation), the fingerprints of CO2-related climate change should be more apparent in the night-time minimum temperatures than in the daytime maxima.
To give night-time minimum temperatures their moment in the sun, or at least a bit more attention, here are some charts that provide a summary of the “climatology of minimum daily temperature” (aka Tmin to its friends). The data comes from historical observations provided by Met Éireann, and for the future projections, from the “down-scaling” of half-a-dozen global climate models using high-resolution regional models centred on Ireland, by Paul Nolan and Jason Flanagan of ICHEC.
Some metadata: the observations span the 30 years from 1976 to 2005, and cover the land area of the Republic of Ireland on a regular grid with about 1.5km resolution. The future simulations use the “middle-of-the road” future forcing (i.e., CO2 concentration) scenario, formally known as “reference concentration pathway equivalent to 4.5 Wm-2 radiative forcing”, or RCP-4.5. The charts below are for the 30 years from 2071 to 2100. The “percentile” values shown below from the model ensemble were adjusted to correct for any systematic biases they were found to have when simulating the historical period (1976-2005). (The adjustment used “quantile delta mapping” – google it if you like, or see here.)
The two charts in Fig. 1 show the annual cycle of daily minimum temperature (Tmin) averaged over the Republic of Ireland land area, at different statistical “percentiles”. Tmin is expected to be below the Nth percentile N% of the time. The 50% percentile is the same as the median, since about half the Tmin samples should fall below it, and half above. The left panel of Fig. 1 shows that the median Tmin this time of year has been somewhere between 11 and 12°C.
Our real focus though is on the 99th percentile of Tmin, shown as the uppermost red curves in both charts. The observations (left chart) report that during summer months in the recent climatological past, about 1% of Tmin values exceeded 16°C or so. By the end of the 21st century, however, that 99-percentile threshold is projected to increase to about 18°C, as shown on the right panel.
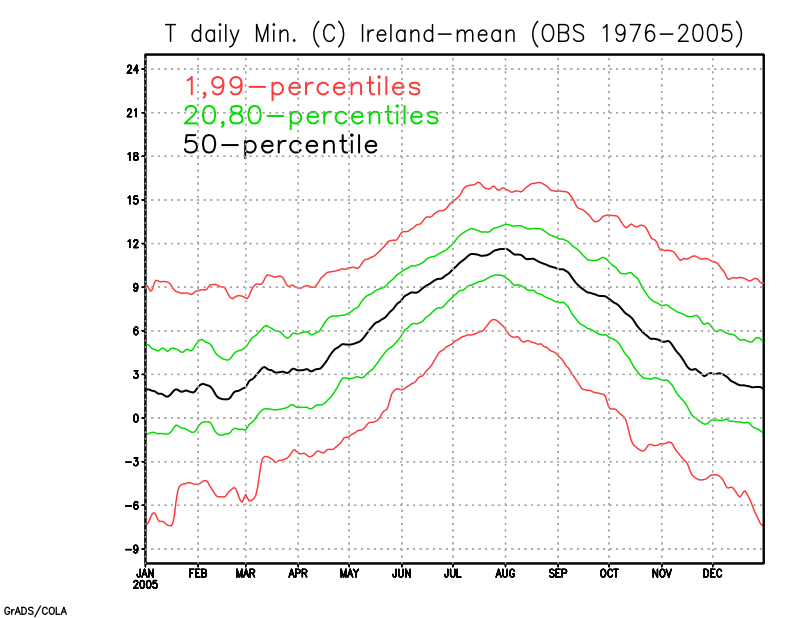
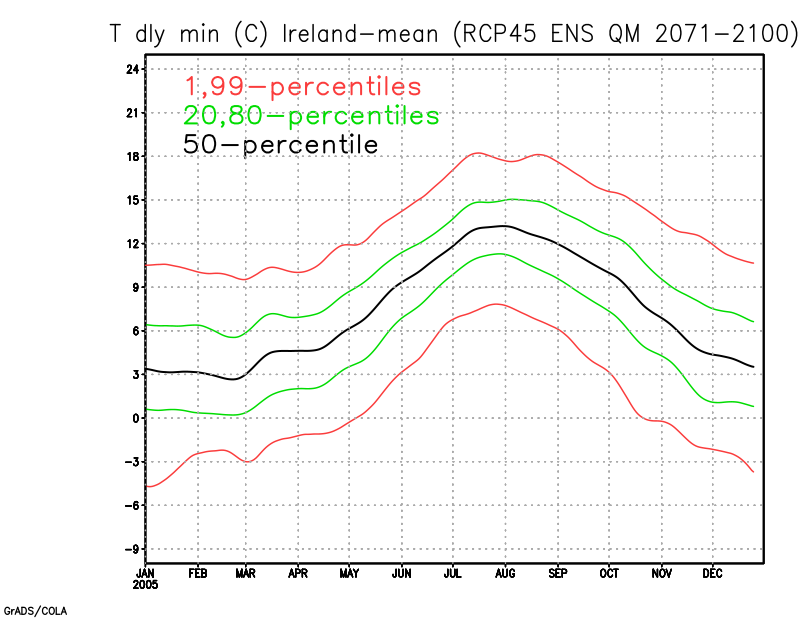
Figure 1 Annual cycle of selected Tmin percentiles, averaged over the RoI land area. The left panel is from observations 1976-2005, the right panel is from future simulations of 2071-2100 under the RCP-4.5 forcing scenario.
The two charts in Fig. 2 show maps of the Tmin 99th percentile from past observations (left panel) and from future simulations (right panel). There are a lot more of the warmer (red) colours on the right panel than on the left – about 2°C more, at most places.
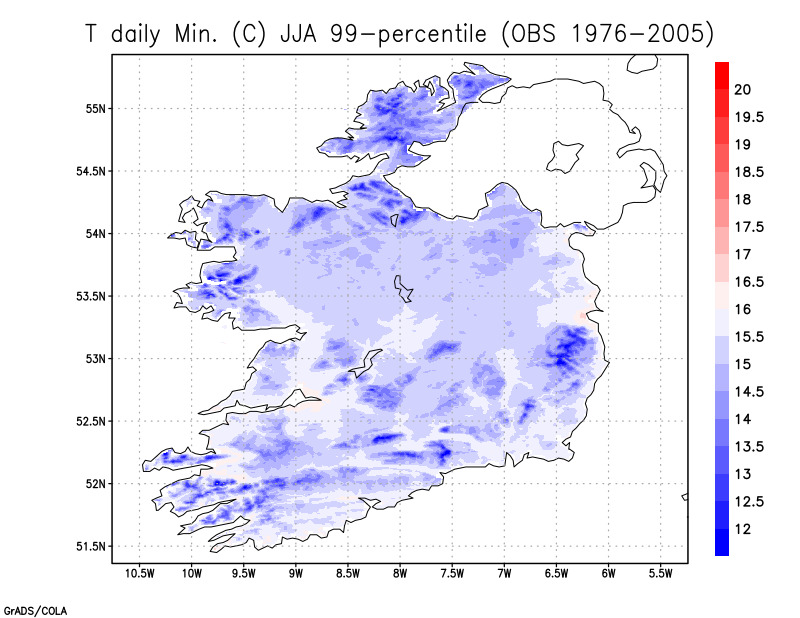
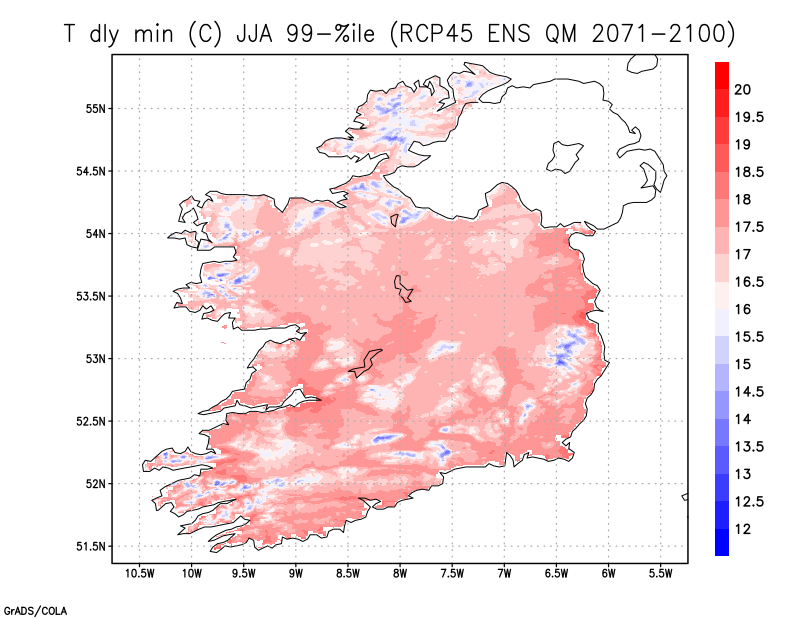
Figure 2 Maps of the 99th percentile Tmin from observations (left) and as projected for 2071-2100 under RCP-4.5 forcing (right), for the summer months (June, July, August).
Another way to look at this is to take a temperature range, and ask how often does Tmin fall within that range? Fig. 3 answers that question for a range of Tmin between 18 and 20°C, for the 3 summer months (June-August). That 18-20°C is the highest that contains any entries at all from the observations: the 20-22°C range (or higher) is completely empty. The future projections, however, do show some rare (fewer than 1 in 100) occurrences of Tmin values between 20 and 22°C everywhere within the country.
Nobody knows for sure how the future will turn out, and especially what the future forcing of the climate will look like. Given any particular forcing scenario, however, models nowadays are pretty good at simulating how the climate will change in response. Models are run under all sorts of forcing assumptions, but the RCP-4.5 scenario presented here is generally considered “middle of the road” – not the best case (where we all stop burning fossil fuels right away) or the worst case either (where oil and coal burning continues without inhibition). Most likely, we’ll see a lot more heat warnings from Met Éireann in the coming years.
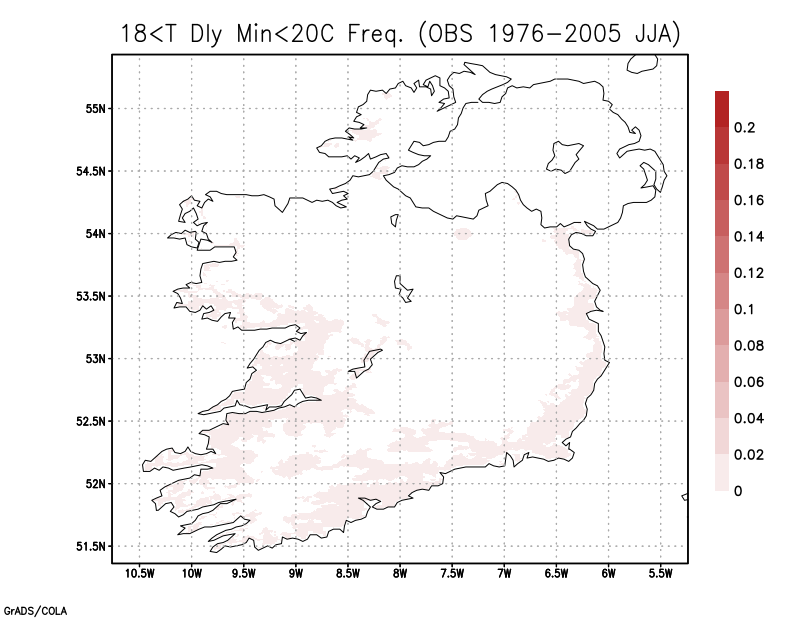
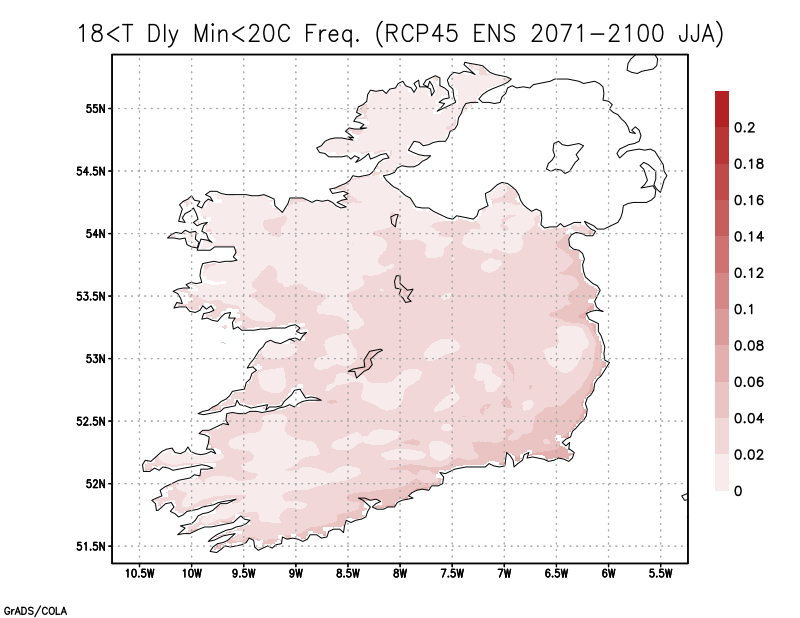
Figure 3 Frequency of occurrence of Tmin between 18 and 20°C during summer months from observations (left) and future projections for 2071-2100 under RCP-4.5 forcing.