

ICHEC Contact
Paul Nolan, Ph.D.
High-Resolution Climate Projections for Ireland – a Multi-Model Ensemble Approach
This project involved using Regional Climate Models (RCMs) to simulate the 21st-century climate of Ireland. The simulations were run on the ICHEC supercomputer at high spatial resolution (~4 km), allowing a more realistic representation of important physical processes and enabling a more accurate evaluation of the local impacts. To address the uncertainty inherent in climate model projections, different RCMs (WRF and COSMO-CLM) were used to downscale outputs from a number of different CMIP5 (Coupled Model Intercomparison Project – Phase 5) Global Climate Models (CNRM-CM5, EC-Earth, HadGEM2-ES, MIROC5 and MPI-ESM-LR). A statistical analysis of the resulting multi-model ensemble of downscaled datasets was completed allowing for the uncertainty in the projections to be partially quantified. To address the uncertainty in future emissions and changing land use, and how the world will come together to response to the challenge of climate change, the future climate was simulated under Representative Concentration Pathway 2.6 (RCP2.6) RCP4.5, RCP6.0 and RCP8.5 scenarios.
Running such a large ensemble of high resolution climate models is a substantial computational task and required extensive use of the ICHEC supercomputer systems over 3 years.
The final report was published in 2020 as part of the EPA Research Programme. From 2019, the research was also funded by Met Éireann and the Marine Institute. A copy of the EPA report ‘Research 339: High-Resolution Climate Projections for Ireland - A Multi-model Ensemble Approach’ is available here.
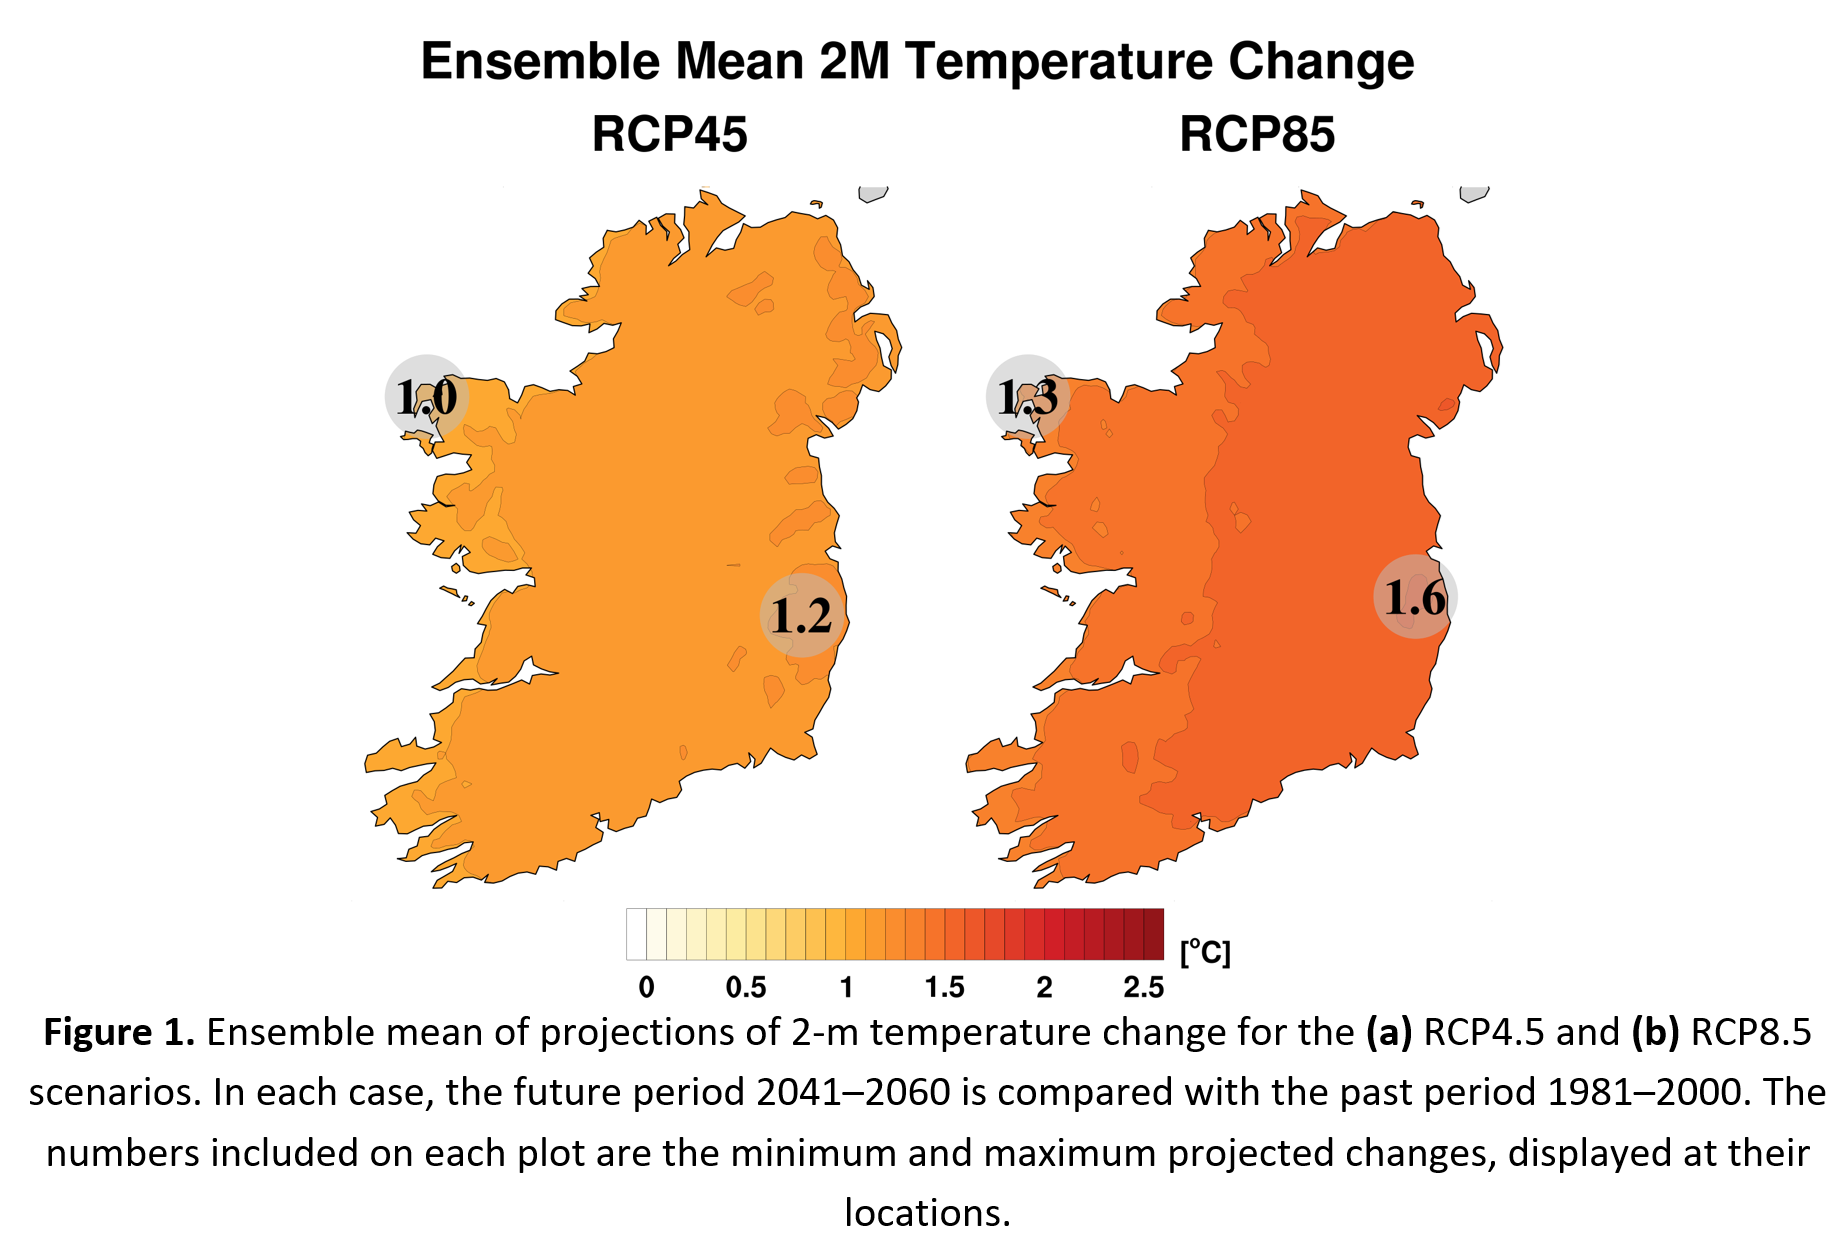
Selected findings from this study indicate that by the middle of this century (2041–2060):
- temperatures are projected to increase by 1–1.6°C compared with the baseline period (1981–2000), with the largest increases in the east (Figure 1);
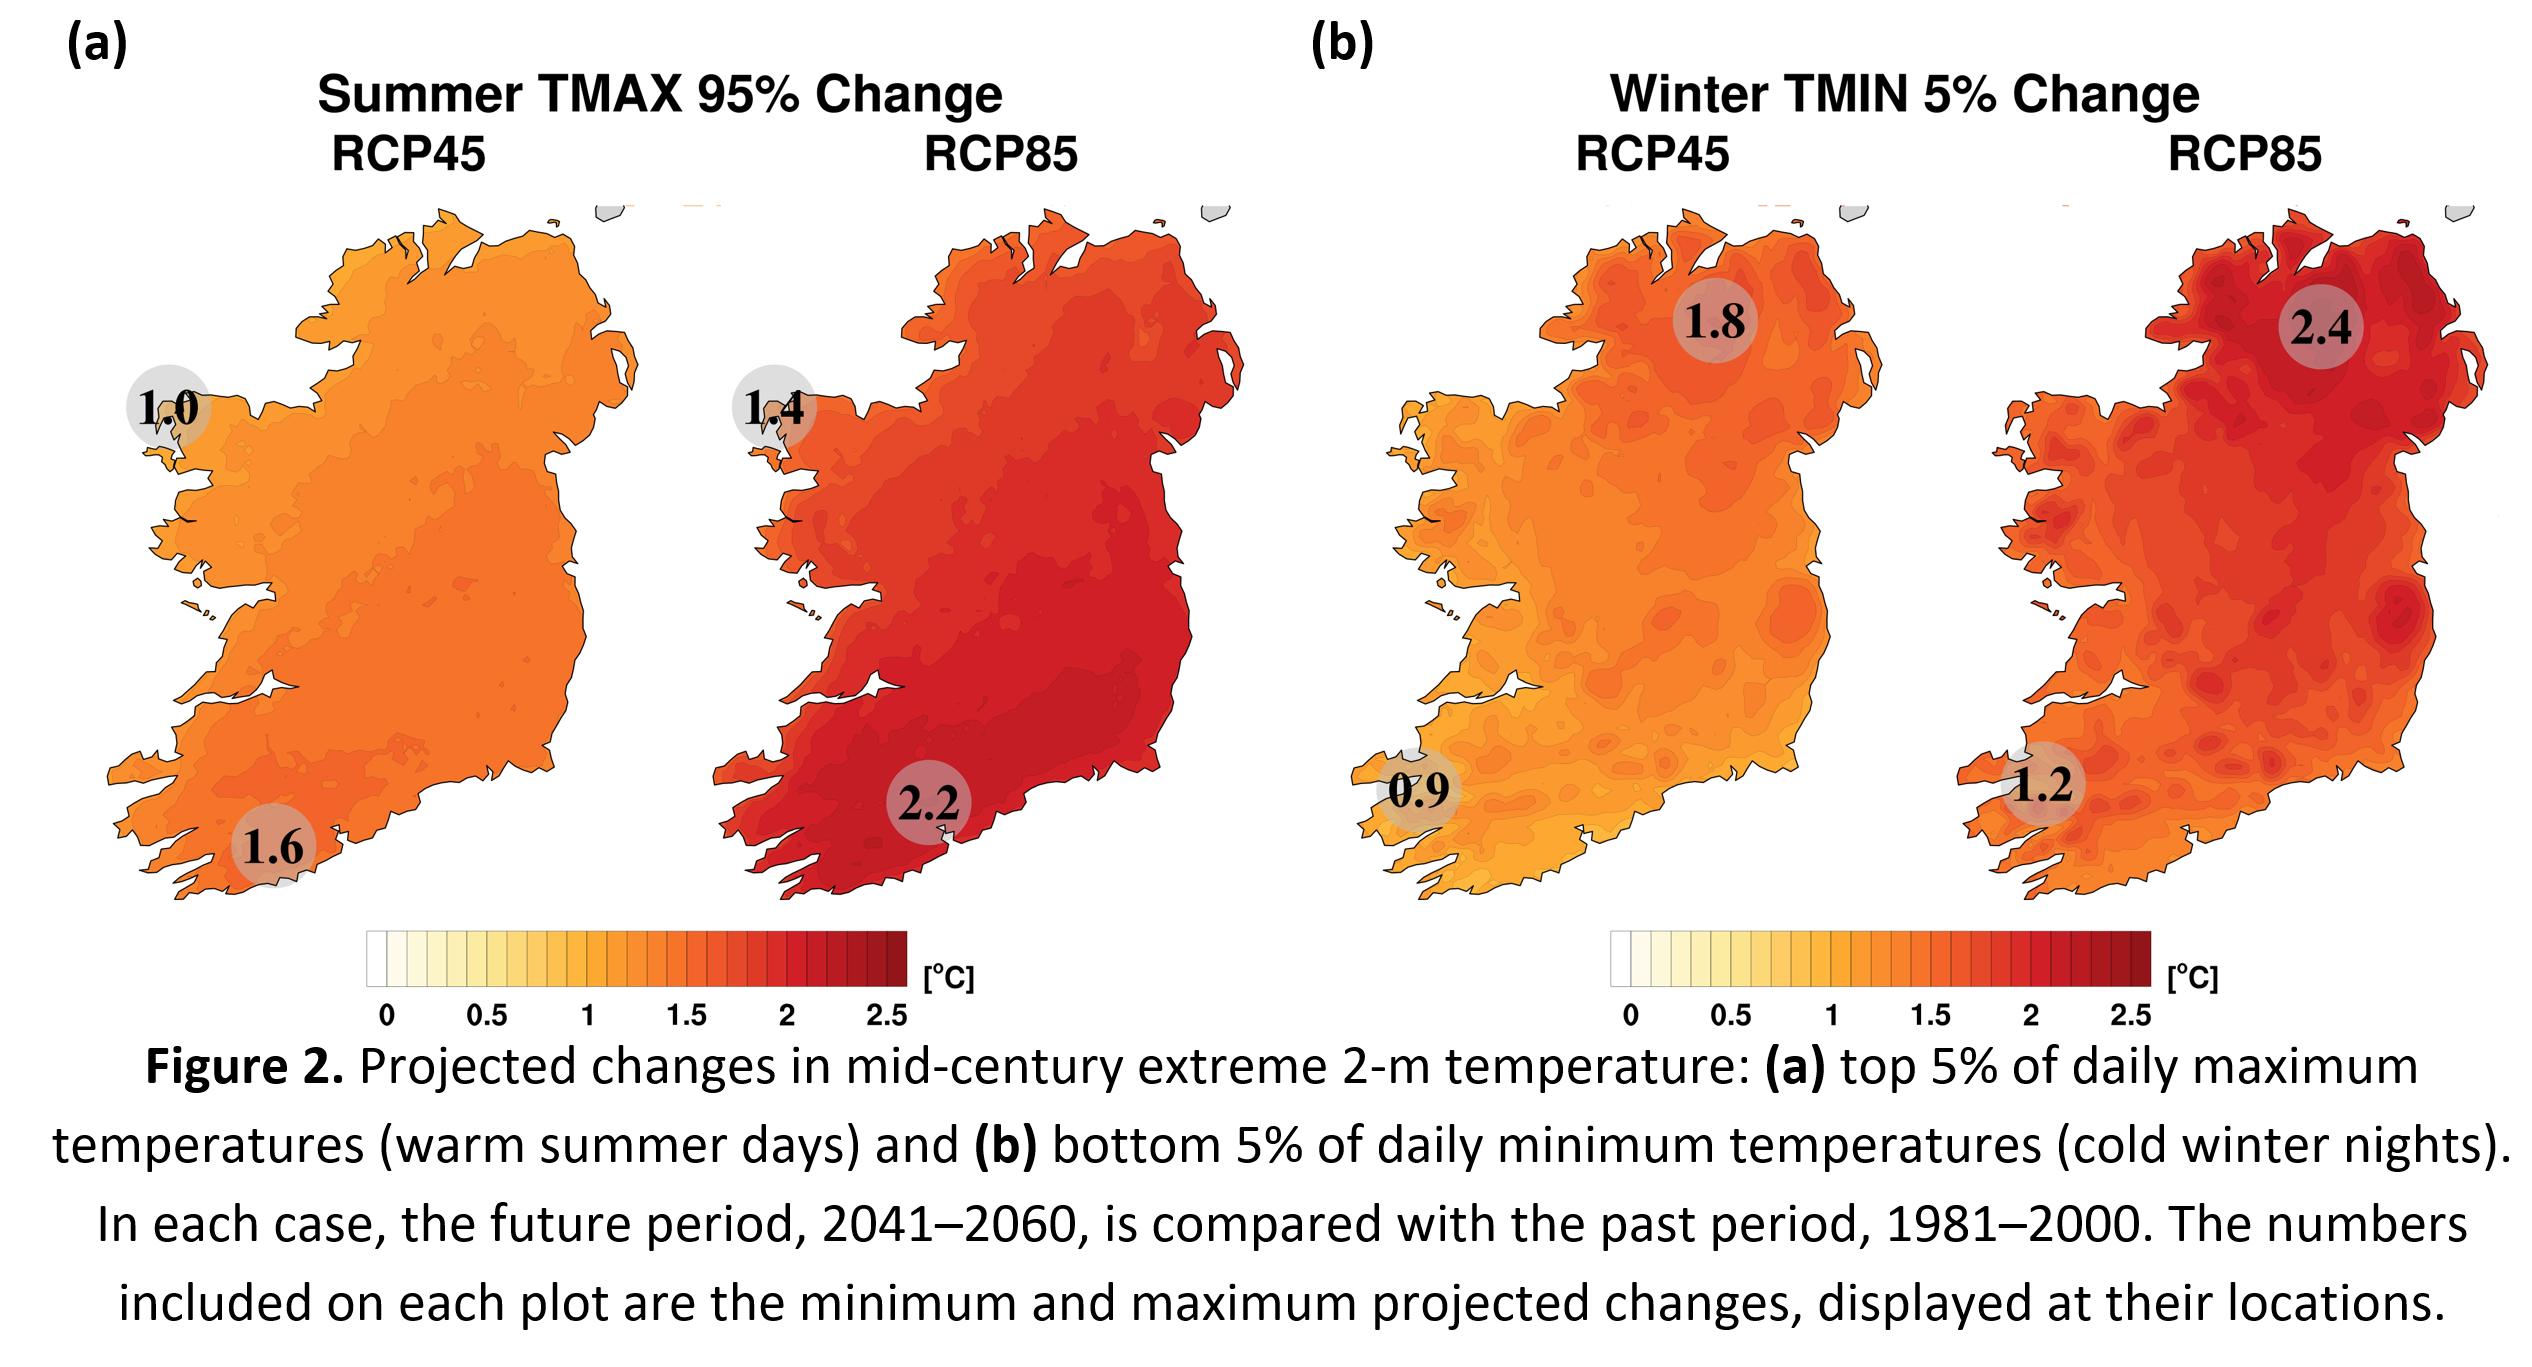
- warming will be enhanced at the extremes (i.e. hot days and cold nights), with summer daytime (Figure 2a) and winter night-time (Figure 2b) temperatures projected to increase by 1–2.4°C;
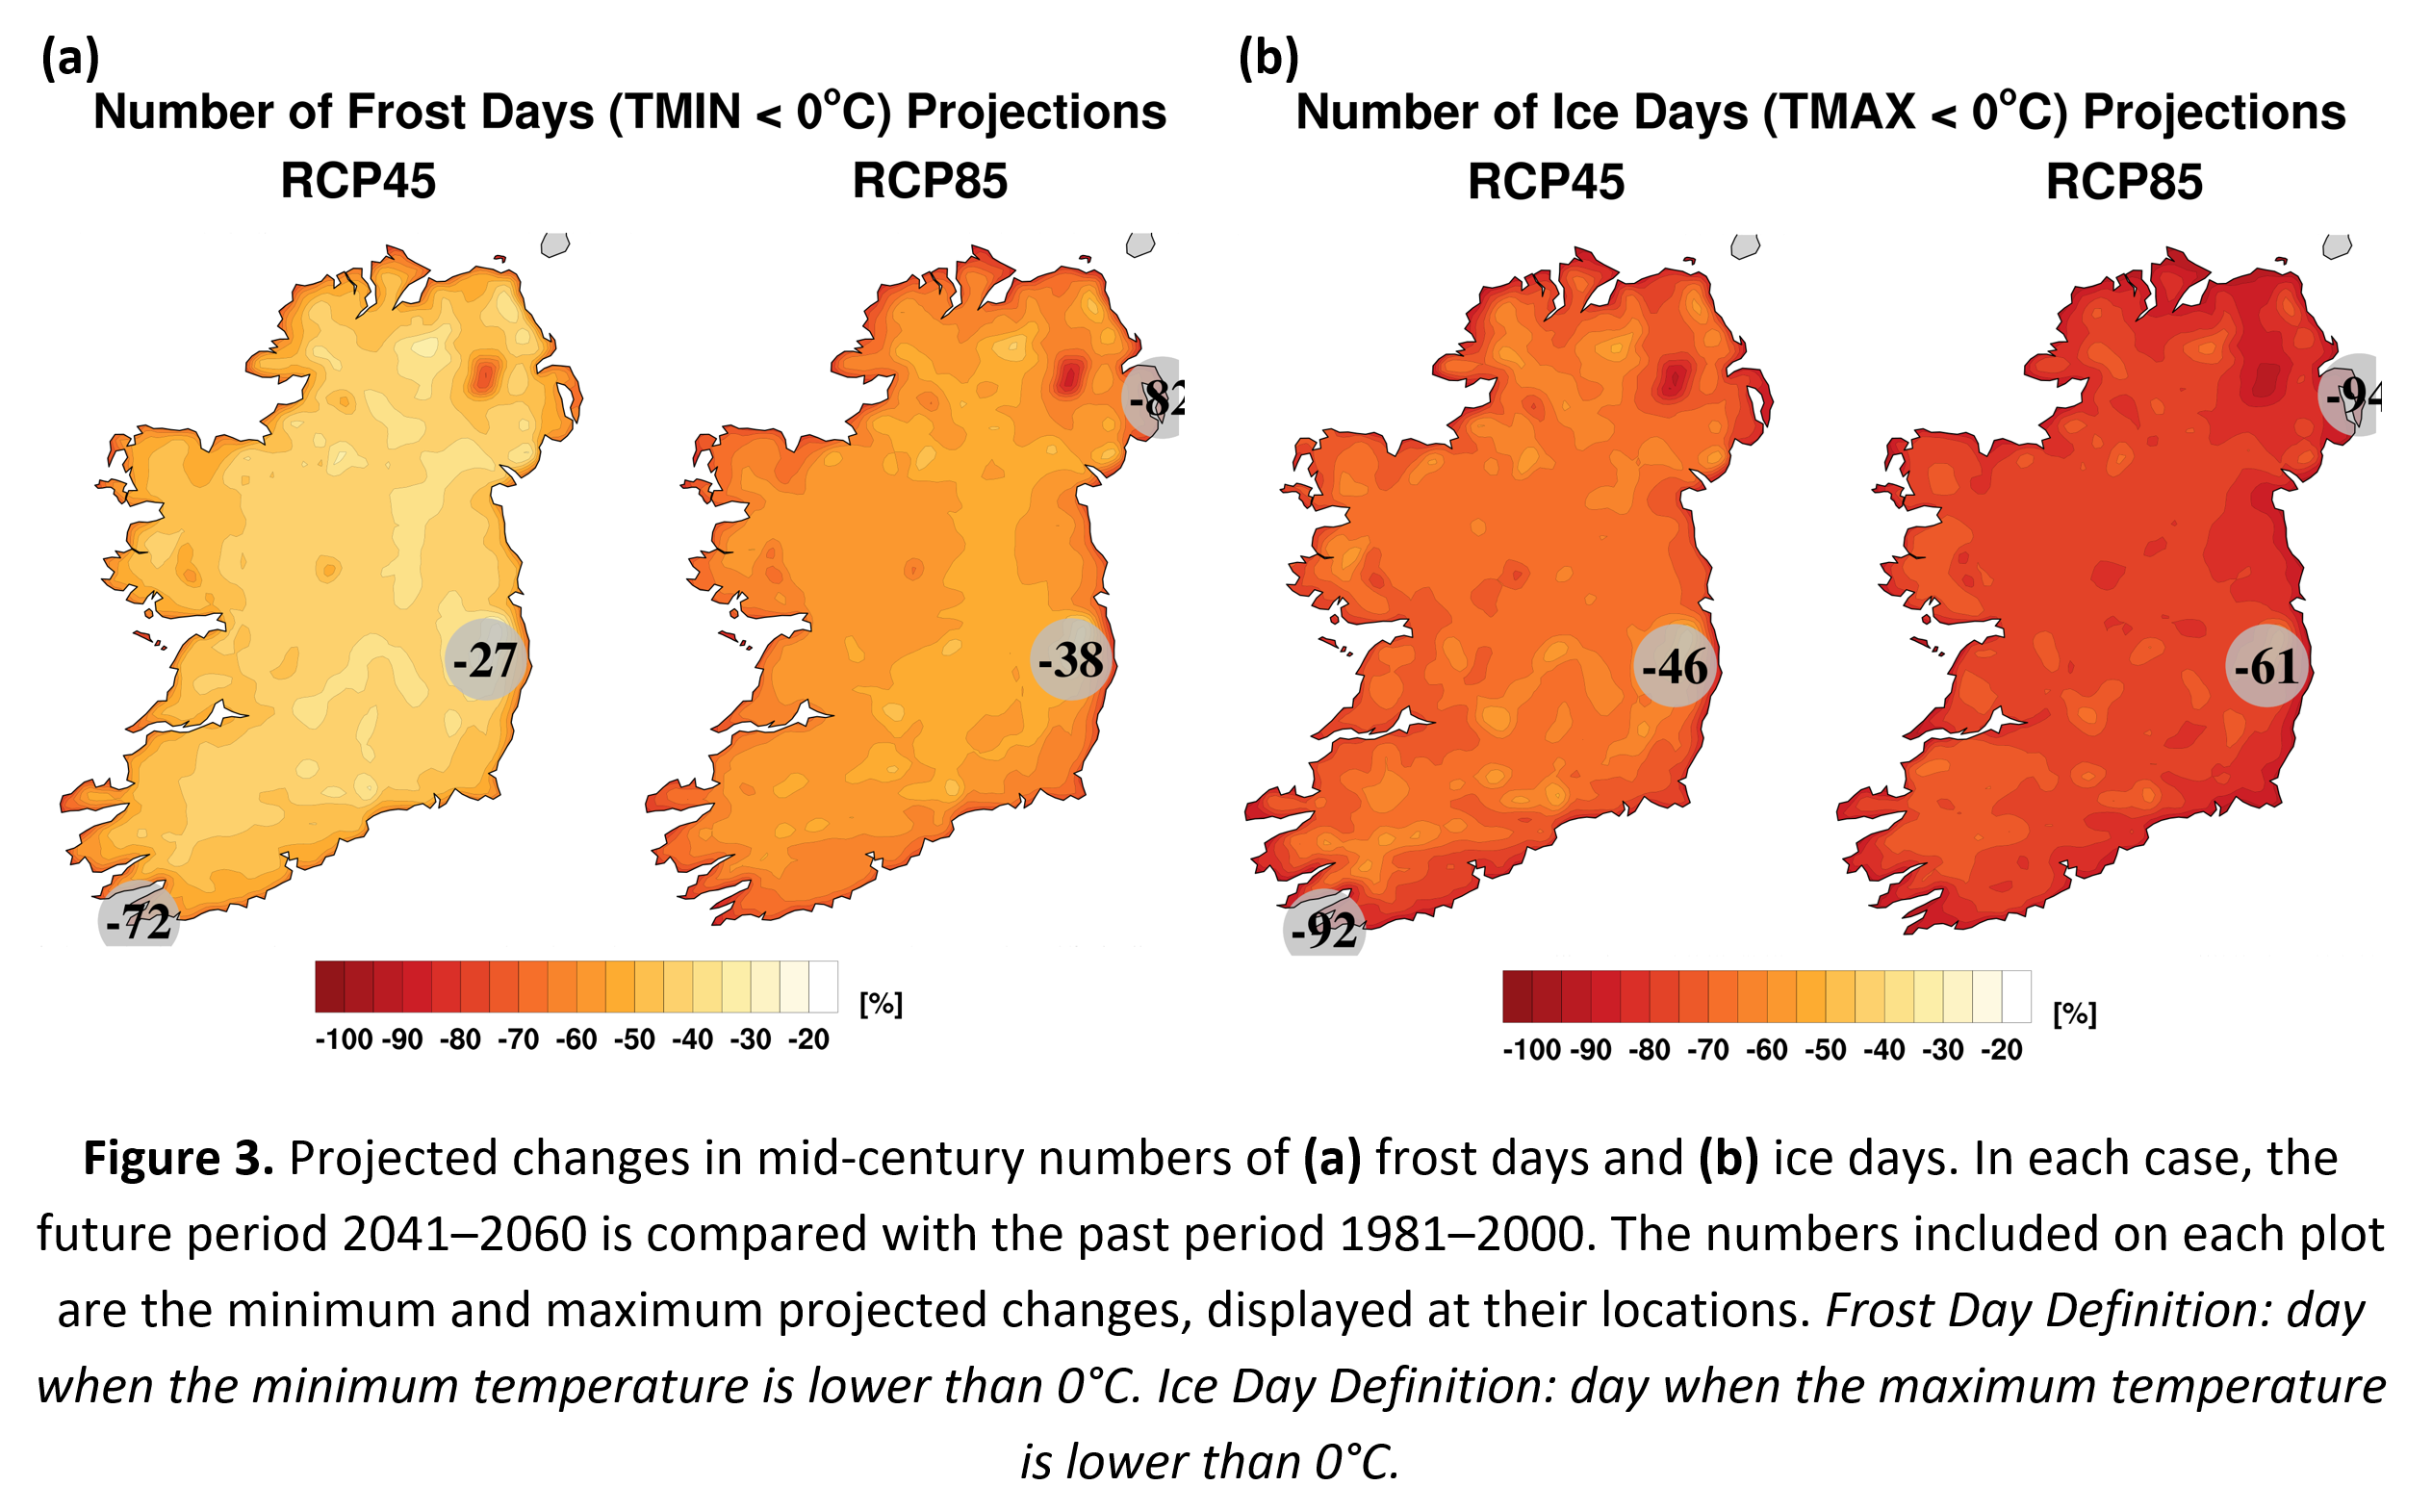
- substantial decreases of approximately 50% are projected in the number of frost (Figure 3a) and ice days (Figure 3b);
- summer heatwave events are expected to occur more frequently, with the largest increases in the south (Figure 4);
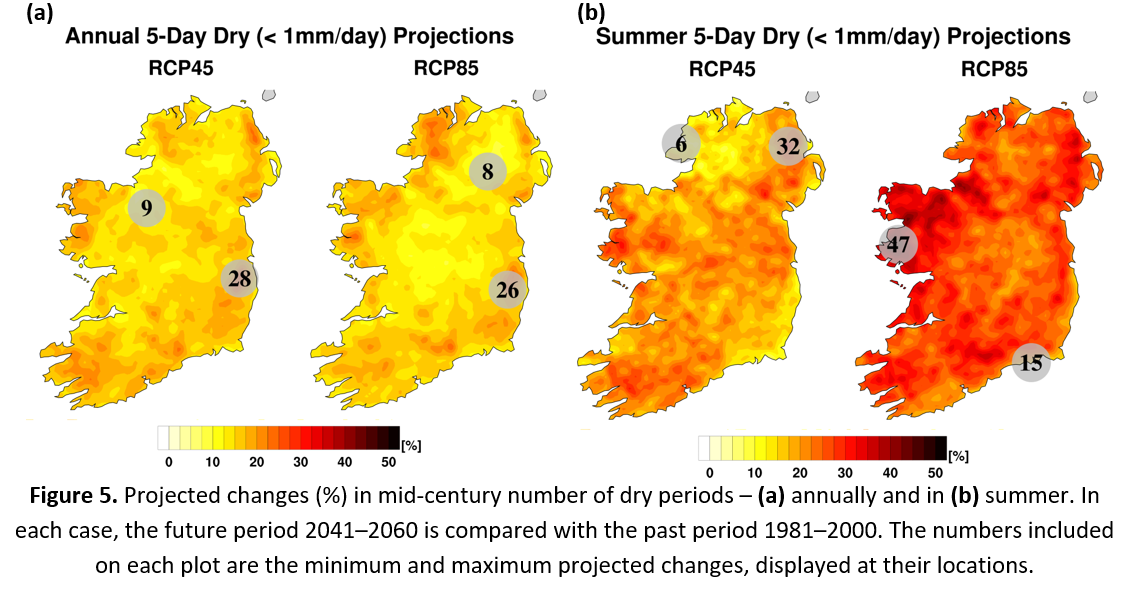
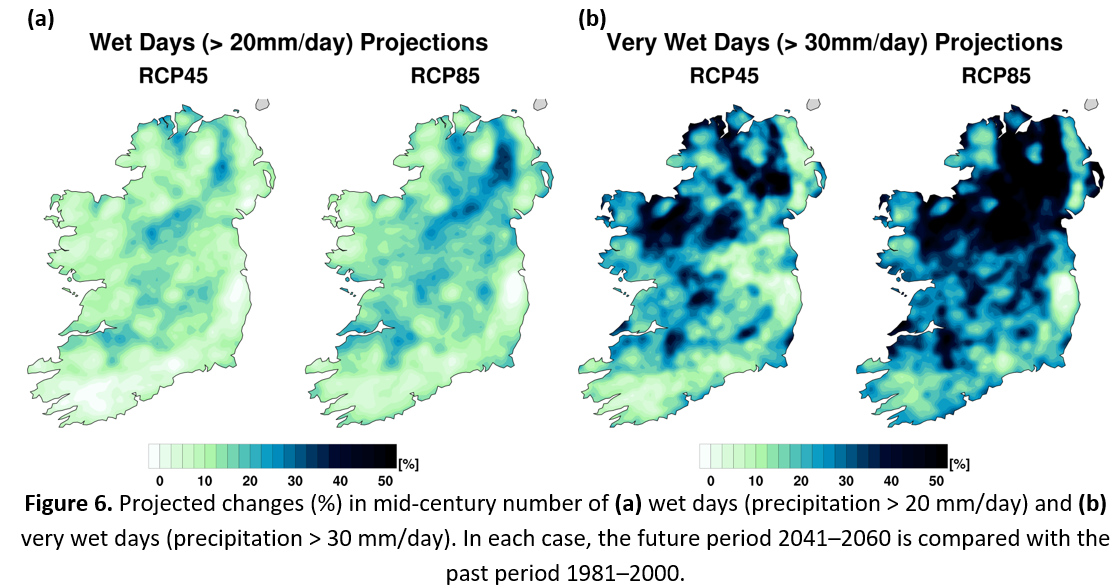
- the precipitation climate is expected to become more variable, with substantial projected increases in the occurrence of both dry periods (Figure 5) and heavy precipitation events (Figure 6)
- the projected increases in dry periods are largest for summer (Figure 5b)
- the largest projected increases in heavy precipitation are expected for the winter and autumn months.
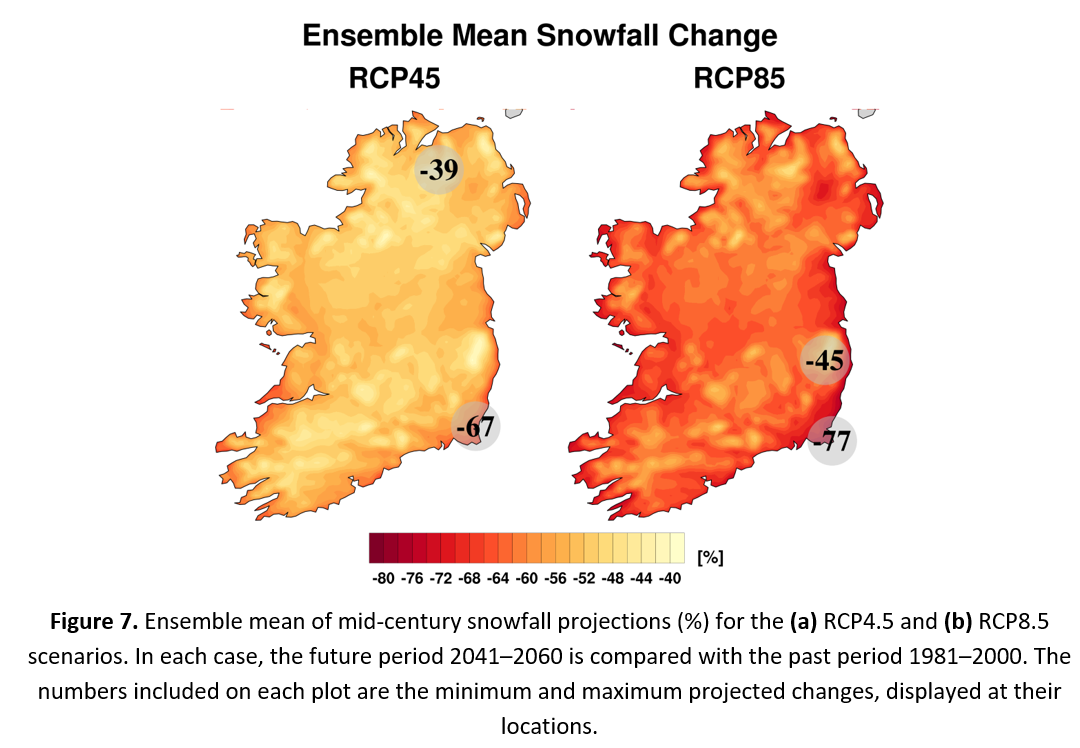
- Snowfall is projected to decrease substantially by the middle of the century with reductions of over 50% (Figure 7).
- The energy content of the 120 m (turbine height) wind is projected to decrease for all seasons with the largest decreases noted for summer.
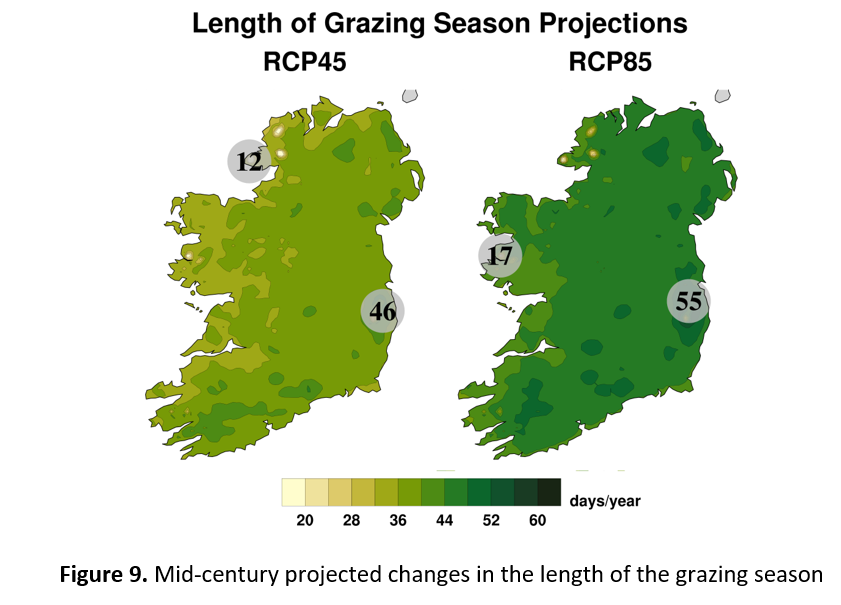
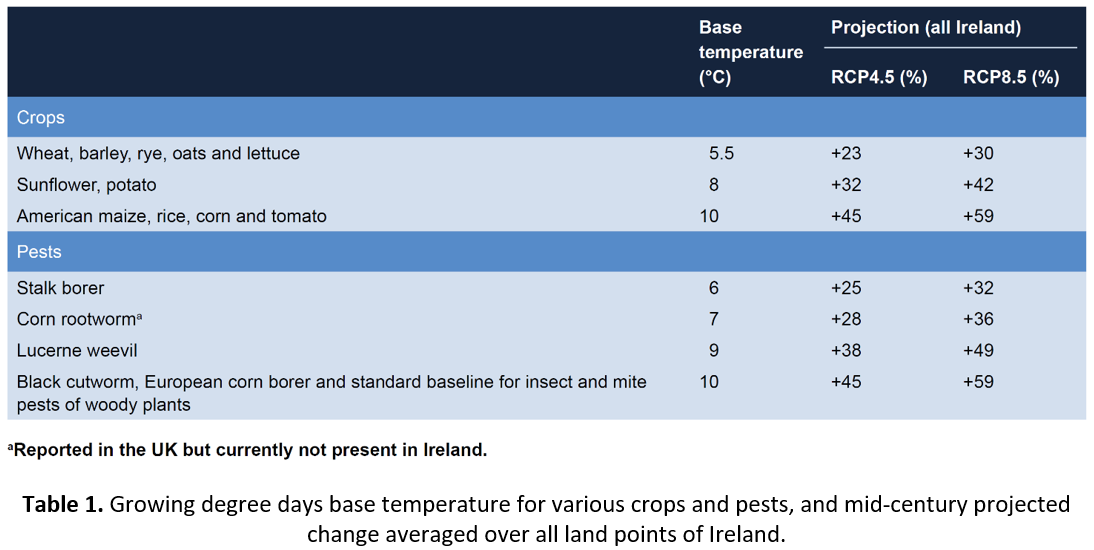
- the length of the growing season is projected to increase by between 12% and 16% (Figure 8a). Similarly, the grazing season (Figure 9), crop heat units (CHUs) and growing degree days (GDDs) for a range of crops (and pests) (Table 1) are projected to increase substantially by the middle of the century.
- Substantial changes in storm tracks, increases in mean sea level pressure, surface evapotranspiration, specific humidity and cooling demand, along with decreases in 10m wind speed, heating demand and solar energy resources are also projected by mid-century.
The research presents projections of additional climate fields and derived variables that are of importance to sectors including agriculture, health, energy, biodiversity and transport. The climate projections of the current study are in broad agreement with previous research which adds a measure of confidence to the projections.

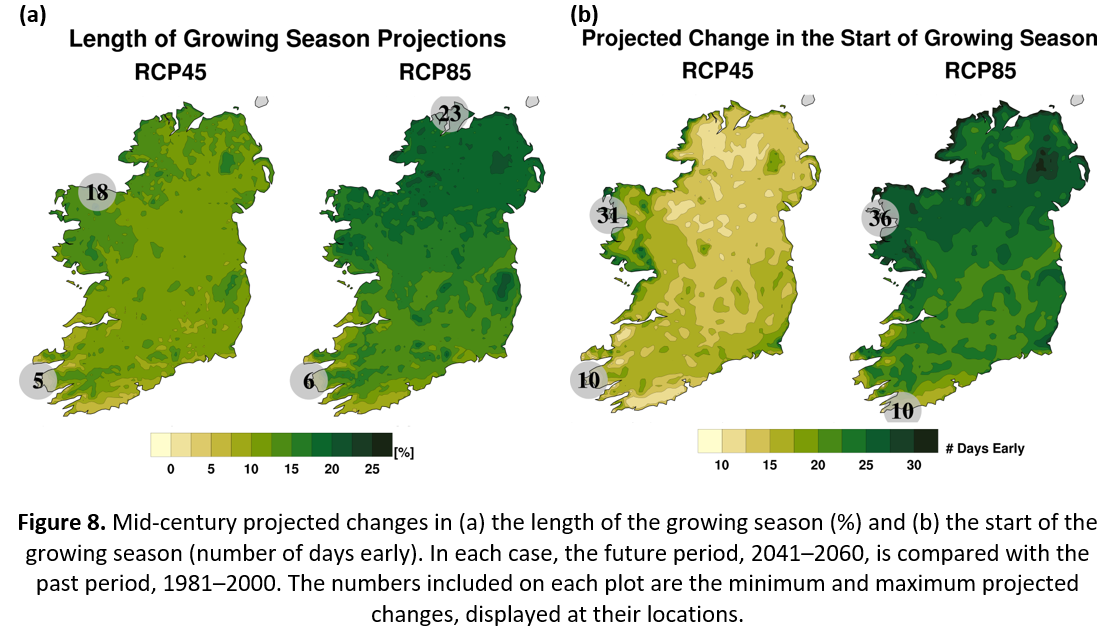
Definition of Growing Season used in the Report: Within a period of 12 months, the thermal growing season length is officially defined as the number of days between the first occurrence of at least 6 consecutive days with a daily mean temperature > 5°C and the first occurrence of at least 6 consecutive days with a daily mean temperature < 5°C.
The growing season calculation is based solely on temperature and does not take into account the delay before sufficient plant cover is available to support grazing animals or the ability of animals and machinery to pass over land. To capture this, we used the following definition to calculate projected changes in the “grazing season”:
GzS = 29.3T – 0.1 + 19.5
where T is the mean annual 2-m temperature (°C) and R is the mean annual rainfall (mm/year).
Climate Projection Uncertainty
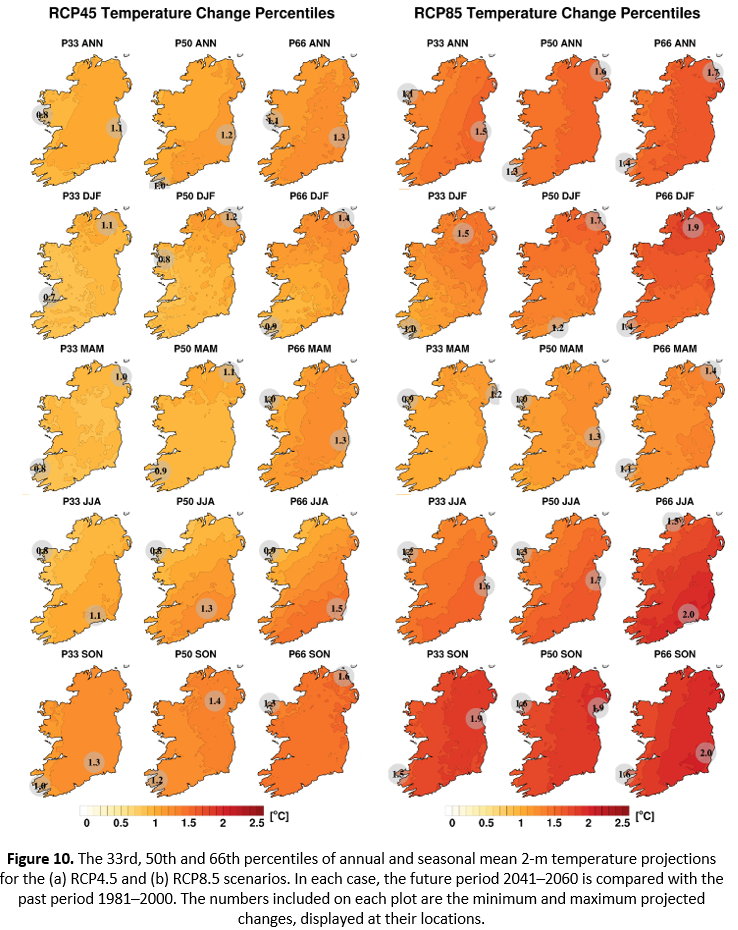
Large individual climate model outliers can skew the mean ensemble projection so it can be more informative to consider percentiles when analysing an ensemble of future projections. The relatively large ensemble size of the current study allows for likelihood values to assigned to the projected changes. Figure 10 presents the 33rd, 50th and 66th percentiles of mid-century annual and seasonal mean 2m temperature projections. For example, the annual figures (top panels) show that over 67% (P33) of the ensemble members project an annual increase in temperatures of 0.8–1.1°C and 1.1–1.5°C for the RCP4.5 and RCP8.5 scenarios, respectively. That is to say, it is “likely” that increases in temperature will be greater than or equal to these values. Similarly, the 66th percentile (P66) provides information on the “unlikely” projection and can be useful for the analysis of high-impact, low-probability projections.
Current Research
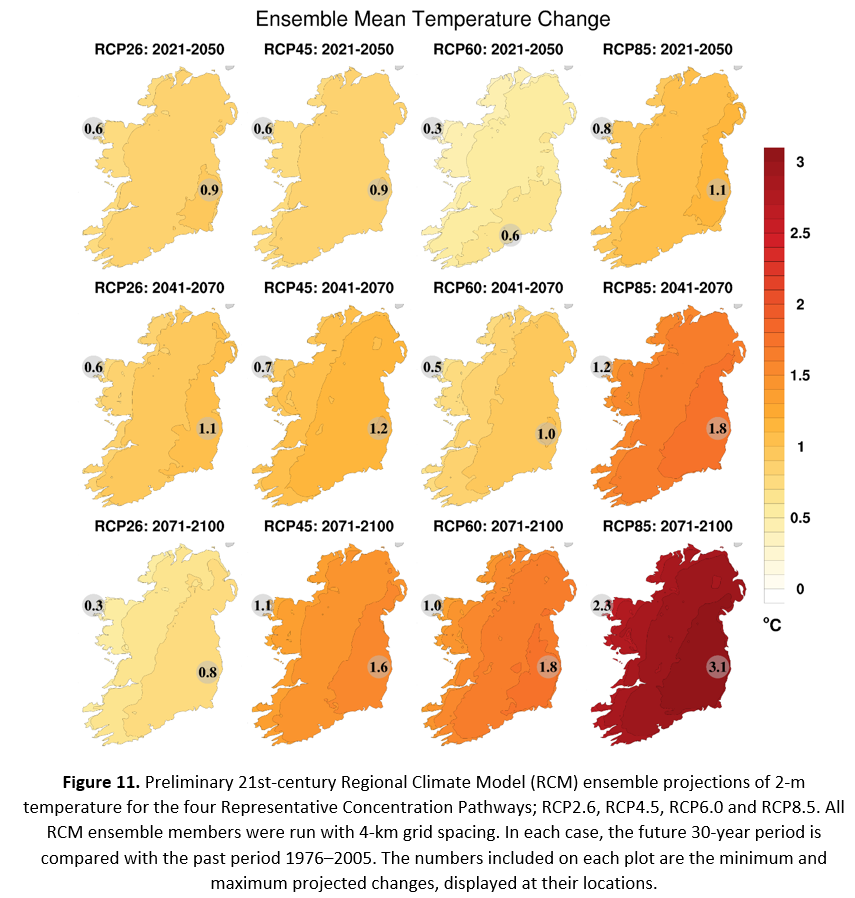
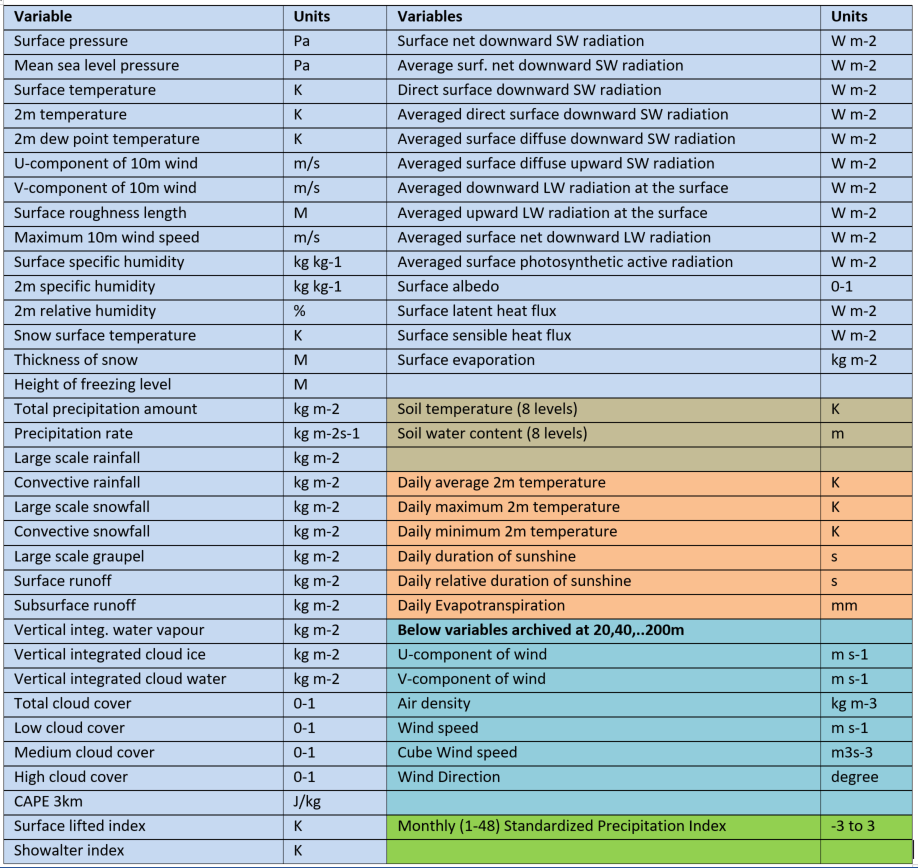
Current work focuses on decreasing the uncertainty of climate projections by utilising the most up-to-date standard and coupled atmosphere-ocean-wave regional climate models, global climate models and greenhouse gas scenarios (SSPs). As part of a separate EPA-, Met Eireann- and Marine Institute- funded projected, we have contributed to the CMIP6 project by running an ensemble of EC-Earth climate simulations (over 4000 years in total) on the ICHEC supercomputer. These simulations comprise Ireland’s contribution to CMIP6 and will be included for assessment in the upcoming IPCC AR6 reports. The datasets are currently being downscaled using the most up-to-date RCMs for all four tier-1 SSP scenarios. Additionally, the accuracy of the model predictions will be enhanced by increasing the model resolution and using fully coupled atmosphere–ocean–wave RCMs (providing high-resolution regional projections of sea level rise and the ocean/wave climate). All simulations cover the continuous period, 1975-2100 (see Figure 11 for preliminary end-of-century temperature projections). An overview of the archived fields is presented in Table 2.
If you are interested in learning more about the project or accessing the datasets, please contact paul.nolan@ichec.ie
DISCLAIMER: Although every effort has been made to ensure the accuracy of the material contained in this website, complete accuracy cannot be guaranteed. Neither the Environmental Protection Agency nor the authors accept any responsibility whatsoever for loss or damage occasioned or claimed to have been occasioned, in part or in full, as a consequence of any person acting or refraining from acting, as a result of a matter contained in this website.