
Project Start Date
01st Apr 2019
Project End Date
31st Mar 2022

ICHEC Contact
Paul Nolan, Ph.D.
Ireland's Contribution to CMIP6 and High-Res Regional Climate Projections for Ireland

The research is funded by the EPA, Met Éireann and the Marine Institute.
The first component of the research involves simulating climate change on a global scale using the EC-Earth Earth System Model (ESM). A large ensemble of EC-Earth simulations was run on the ICHEC and ECMWF supercomputing systems. The resulting datasets comprise Ireland’s contribution to the Coupled Model Intercomparison Project (phase 6) (CMIP6) and are currently being analysed for inclusion in the U.N. Intergovernmental Panel on Climate Change (IPCC) AR6 reports. The datasets (~1.5 PB in size) were standardized ("cmorized"), quality controlled, validated and shared with the international research community on the ICHEC Earth System Grid Federation (ESGF) node. The PI also contributed to the CMIP6 CovidMIP modelling experiment, an international collaboration of climate institutes (led by the UK Met Office). The aims of CovidMIP is to investigate whether the COVID-19 induced reduction in emissions have any impact on the Earth’s climate [1,2]. The PI contributed by running several EC-Earth-COVID simulations and sharing the data with the international research community. The EC-Earth CMIP6 component of the research is fully complete.
The second main component of the research involves updating the current regional climate projection dataset for Ireland (e.g., [3,4]). This is being achieved by running an ensemble of high-resolution downscaled simulations using the most up-to-date Regional Climate Models (RCMs) (both standard and coupled atmosphere-ocean-wave), CMIP6 Global Climate Models and all four “tier-1” SSP emission scenarios (SSP1-2.6, SSP2-4.5, SSP3-7.0 & SSP5-8.5) for the period 1980-2100. All RCM simulations are run on the ICHEC supercomputer. This research, and the resulting regional projections, will continue to inform national climate change policy such as the various governmental sectoral adaptation plans. This downscaling component of the project is ongoing and will be complete in early 2022.
1. IPCC/CMIP6 Global Climate Projections
The following EC-Earth CMIP6 contributions were completed (approximately 3500 years of simulated data in total):
- 7 x EC-Earth AOGCM Historical/Veg simulations 1850-2014
- 28 x EC-Earth AOGCM/Veg ScenarioMIP 2015-2100 simulations; 7 x SSP1-2.6, 7 x SSP2-4.5, 7 x SSP3-7.0 & 7 x SSP5-8.5
Model-level data were archived allowing for international (e.g., CORDEX) and national regional downscaling using regional climate models (see section 2 below).
The simulations are now complete, the data “cmor-ised” and hosted and shared on the ICHEC ESGF node. The EC-Earth ensemble members were validated by comparing the seven historical ensemble members with CRU observational and ECMWF ERA5 reanalysis datasets. The PI completed a comprehensive validation and assessment of the projections of EC-Earth temperature, precipitation, 10m wind speed, mean sea level pressure, total cloud cover, snowfall, sea surface temperature and sea ice fraction (e.g., Nolan at al., 2020 [5]). See Döscher et al. (2021) [6] for additional validations and projections.
Visualizations of projections of global 2m temperature, precipitation and Arctic end-of-summer (September) sea ice fraction are presented below:
CMIP6 EC-EARTH climate projection data. The above visualization shows annual 2m temperature (℃) change with respect to the mean of the pre-industrial baseline period, 1850-1990. In total, 7 historical (1850-2014) and 28 ScenarioMIP simulations (2015-2100) were run. The future climate was simulated under the full range of ScenarioMIP “tier 1” Shared Socioeconomic Pathways (SSPs); SSP1-2.6, SSP2-4.5, SSP3-7.0 & SSP5-8.5. Each panel of the visualization presents the mean of seven EC-Earth ensemble members.
The visualization shows annual precipitation (%) change with respect to the mean of the baseline period, 1981-2010.
Annual September sea ice fraction. The green line shows the 50% contour line. Because of the high heat capacity of water, the Sea Surface Temperature lags behind atmospheric temperatures. Hence, the Arctic sea ice is at a minimum during September.
The full CMIP6 Scenario-MIP ensemble (as available, late 2020) was analysed to assess where our CMIP6 EC-Earth contribution fit within the full ensemble. The following CMIP6 ESMs were analysed:
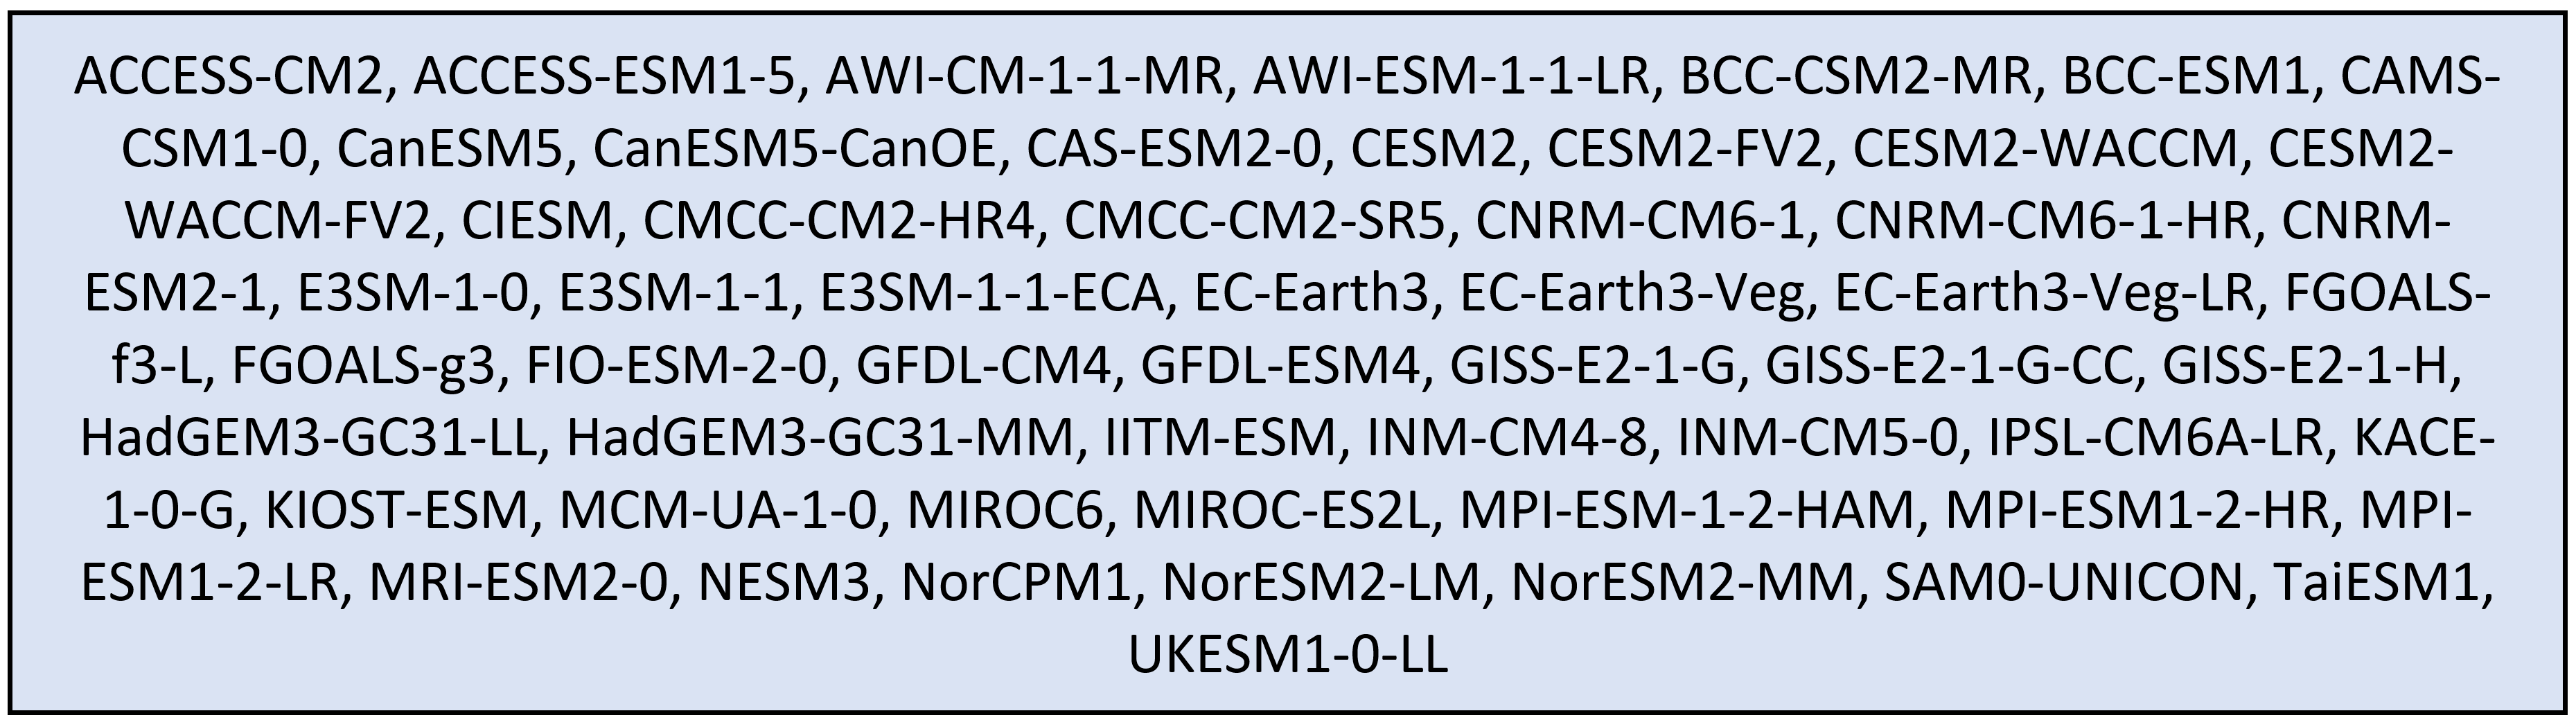
For most of the above models, multiple ensemble members were run. For the future climate, the four tier-1 Shared Socioeconomic Pathways (SSPs; SSP1-2.6, SSP2-2.5, SSP3-7.0 and SSP5-8.5) were analysed.
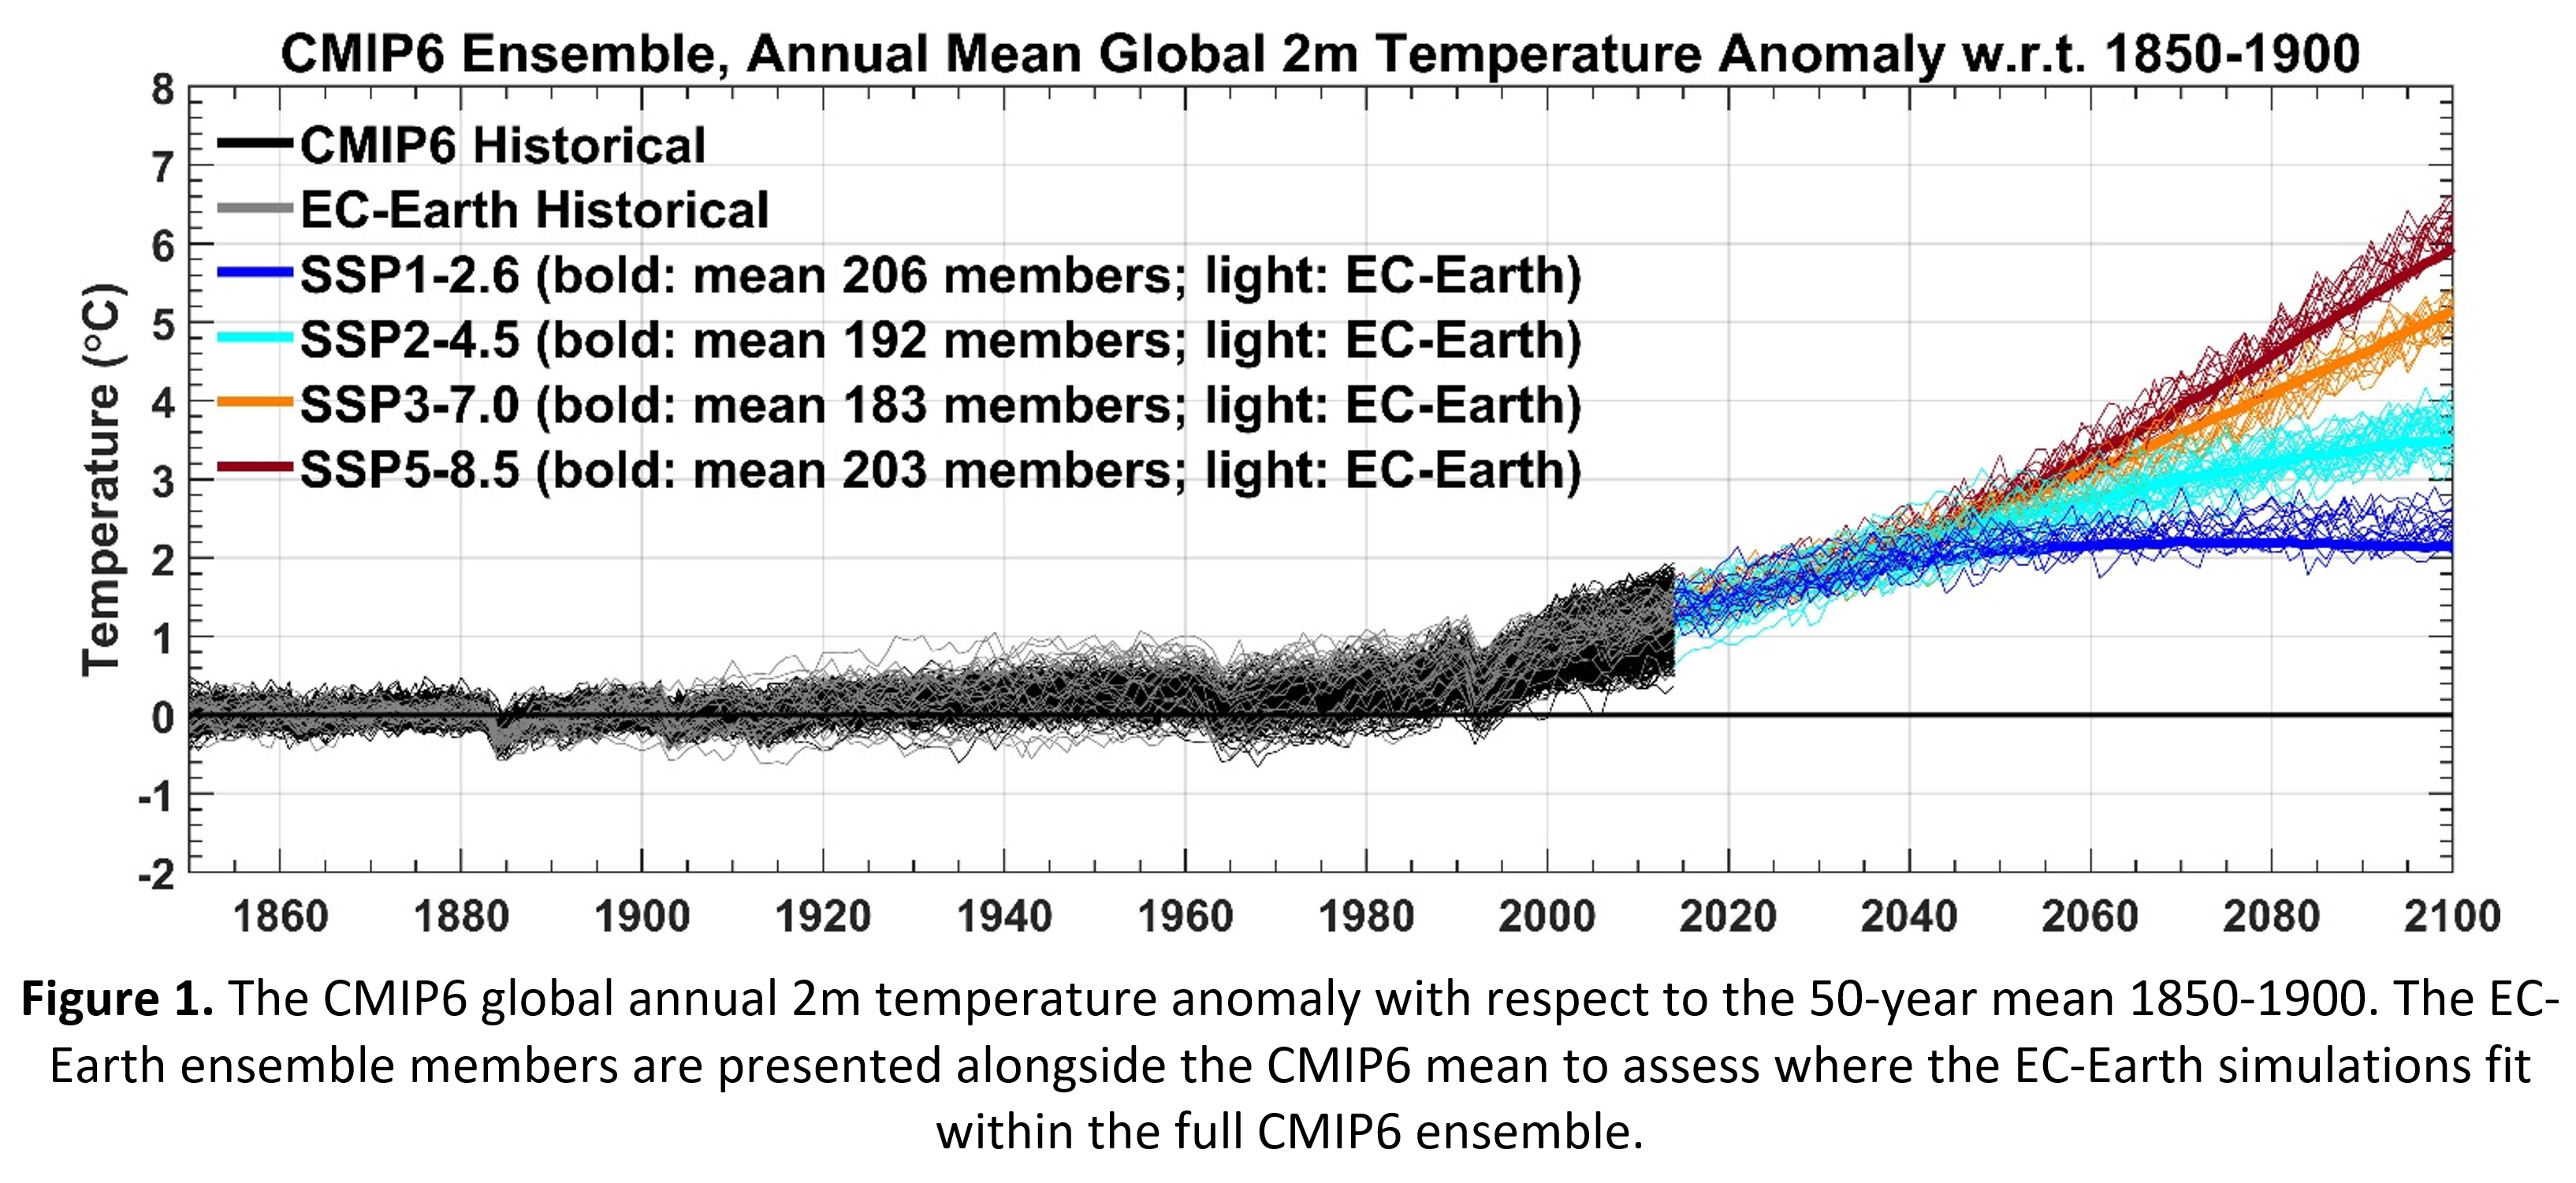
Figure 1 presents the global annual 2m temperature anomaly (1850-2100) with respect to the pre-industrial 50-year mean 1850-1900. The mean of the full CMIP6 ensemble is presented alongside the individual EC-Earth ensemble members. A total of 206 (SSP1-2.6), 192 (SSP2-4.5), 183 (SSP3-7.0) and 203 (SSP5-8.5) CMIP6 ensemble members were analysed.
The below visualizations present a ‘spiral’ visualization of monthly global temperature rise (2000-2100) w.r.t. 1850-1900.
Regional Climate Modelling & National Climate Change Projections
The method of Regional Climate Modelling (RCM) is employed to assess the impacts of a warming climate on the 21st-century climate of Ireland. The RCM simulations are run at high spatial resolution (4km), thus allowing a better evaluation of the local effects of climate change. Additionally, the accuracy of the model predictions is enhanced by using fully coupled atmosphere-ocean-wave RCMs. See here for further details of the coupled RCM simulations.
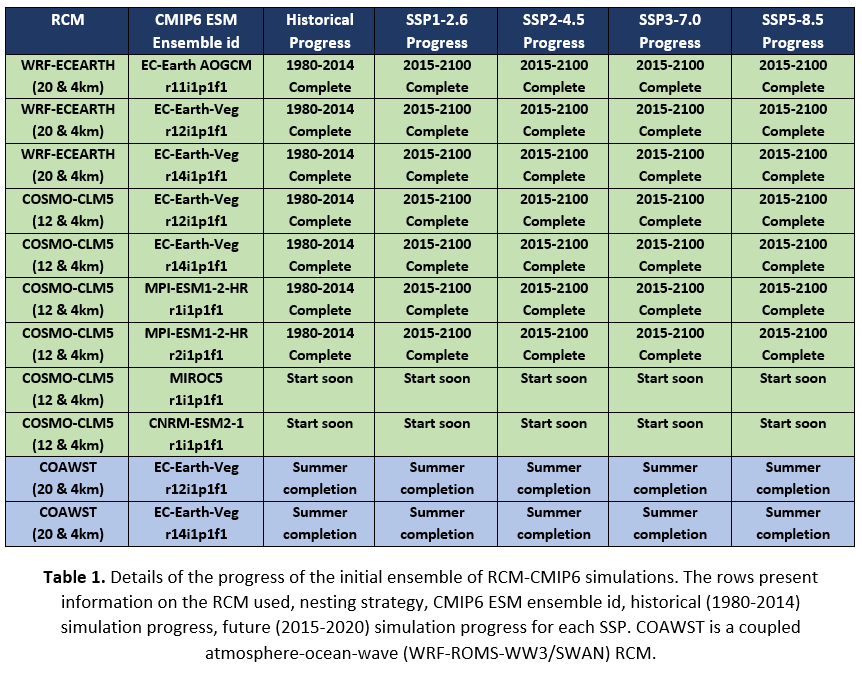
To address the issue of uncertainty, a multi-model ensemble of downscaled CMIP6 is currently being run. Through the ensemble approach, the uncertainty in the projections can be partially quantified, thus providing a measure of confidence in the projections. Simulations are run for a historical period 1980–2014 and ‘future’ period 2015–2100. The COSMO-CLM, WRF and COAWST RCMs are currently being used to downscale the r11i1p1f1-AOGCM and r12i1p1f1- & r14i1p1f1-Vegetation EC-Earth CMIP6 global datasets. To account for the uncertainty in future greenhouse gas emissions, the future climate is simulated under the full range of ScenarioMIP “tier 1” SSPs; SSP1-2.6, SSP2-4.5, SSP3-7.0 & SSP5-8.5 (See Table 1 for details). It should also be noted that Table 1 will be updated over time to include downscaling of additional CMIP6 datasets from the international community.
Furthermore, the RCM work will contribute to the CORDEX project by running the required outer domain of selected RCM simulations (namely, COSMO-CLM-ECEarth r12i1p1f1 & r14i1p1f1) on the Euro-CORDEX domains, conforming to the CORDEX standards, and extending the simulation period to 1950-2100 (for the outer domain).
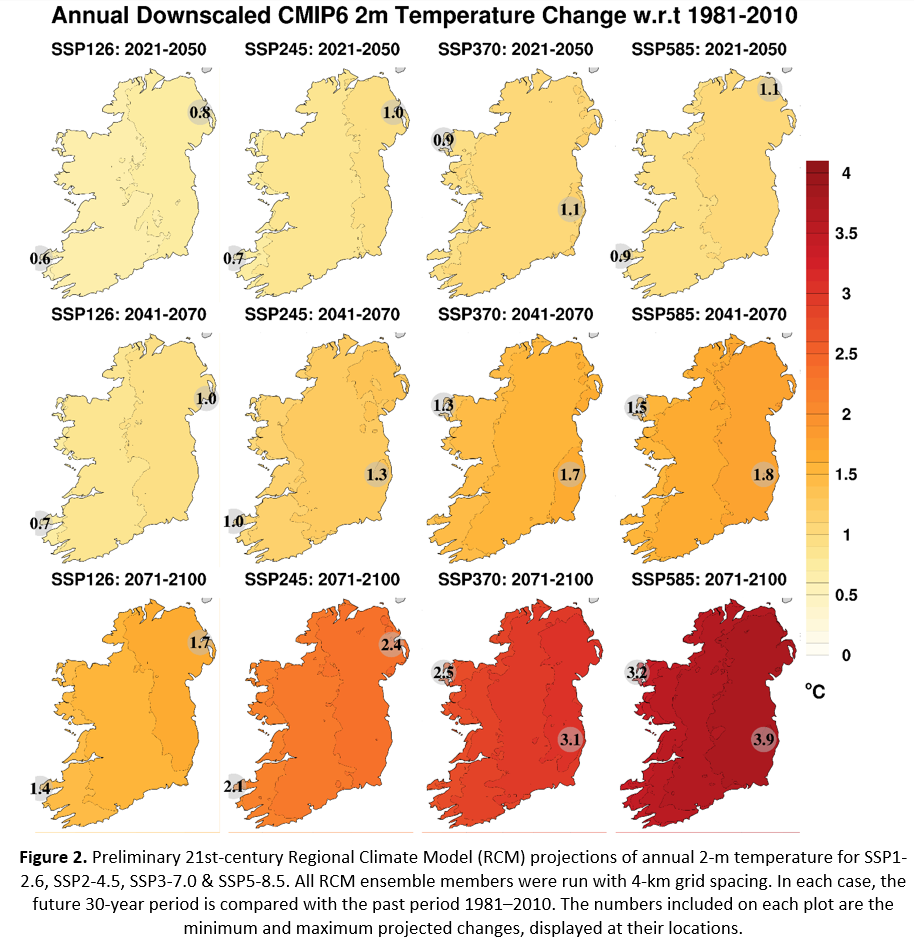
Preliminary 21st-century projections of temperature (for SSP1-2.6, SSP2-4.5, SSP3-7.0 & SSP5-8.5) are presented in Figure 2. Preliminary projections of the wind power resource are presented in Figure 3. Here the wind power is calculated at each 3-hour time step as 0.5×density×cube_120m_wind_speed. Note that these projections will be updated as additional simulations of Table 1 complete.
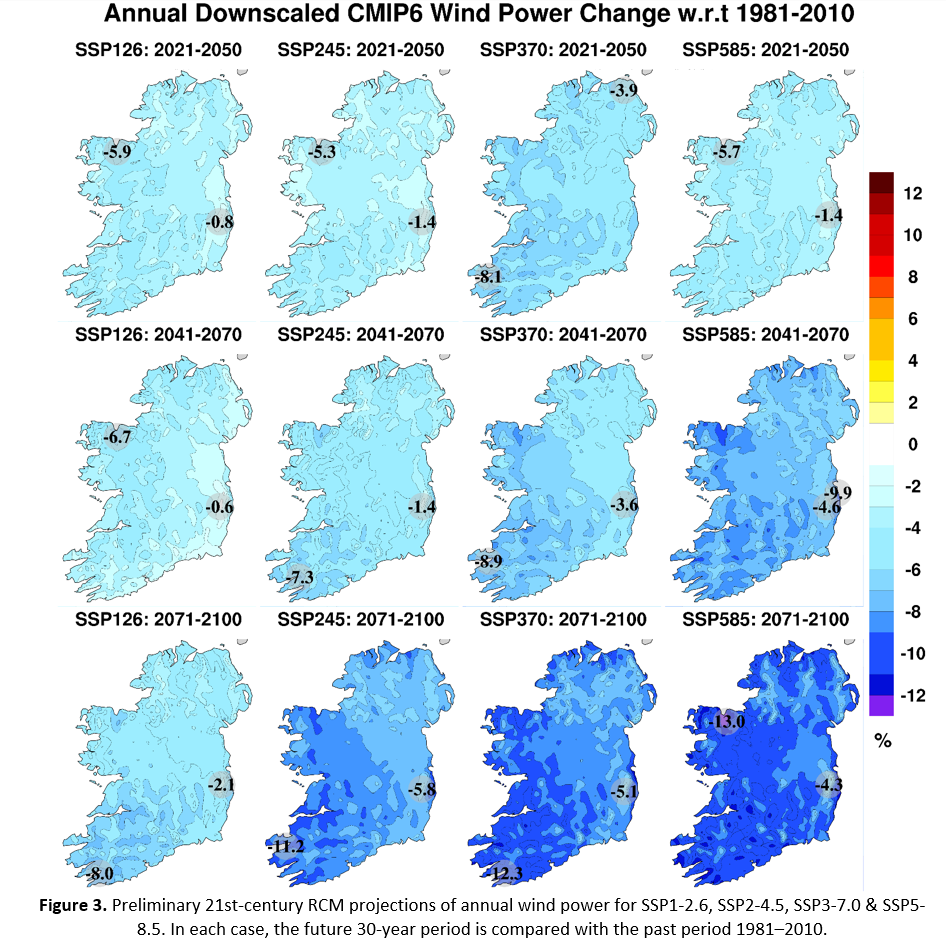
As the number of completed RCM simulations is currently small, it is not possible to assign uncertainty estimates to the projections. This is particularly important when analysing projections of precipitation which typically demonstrate a larger spread (disagreement) in the ensemble members. As the simulations of Table 1 complete, it will be possible to undertake a robust statistical analysis of the projections and better quantify model uncertainty. Nevertheless, it is interesting to compare our preliminary downscaled CMIP6 (SSP scenarios) projections with previously completed downscaled CMIP5 (RCP) projections (see [3,4] for an overview of previous RCM-CMIP5 projections).
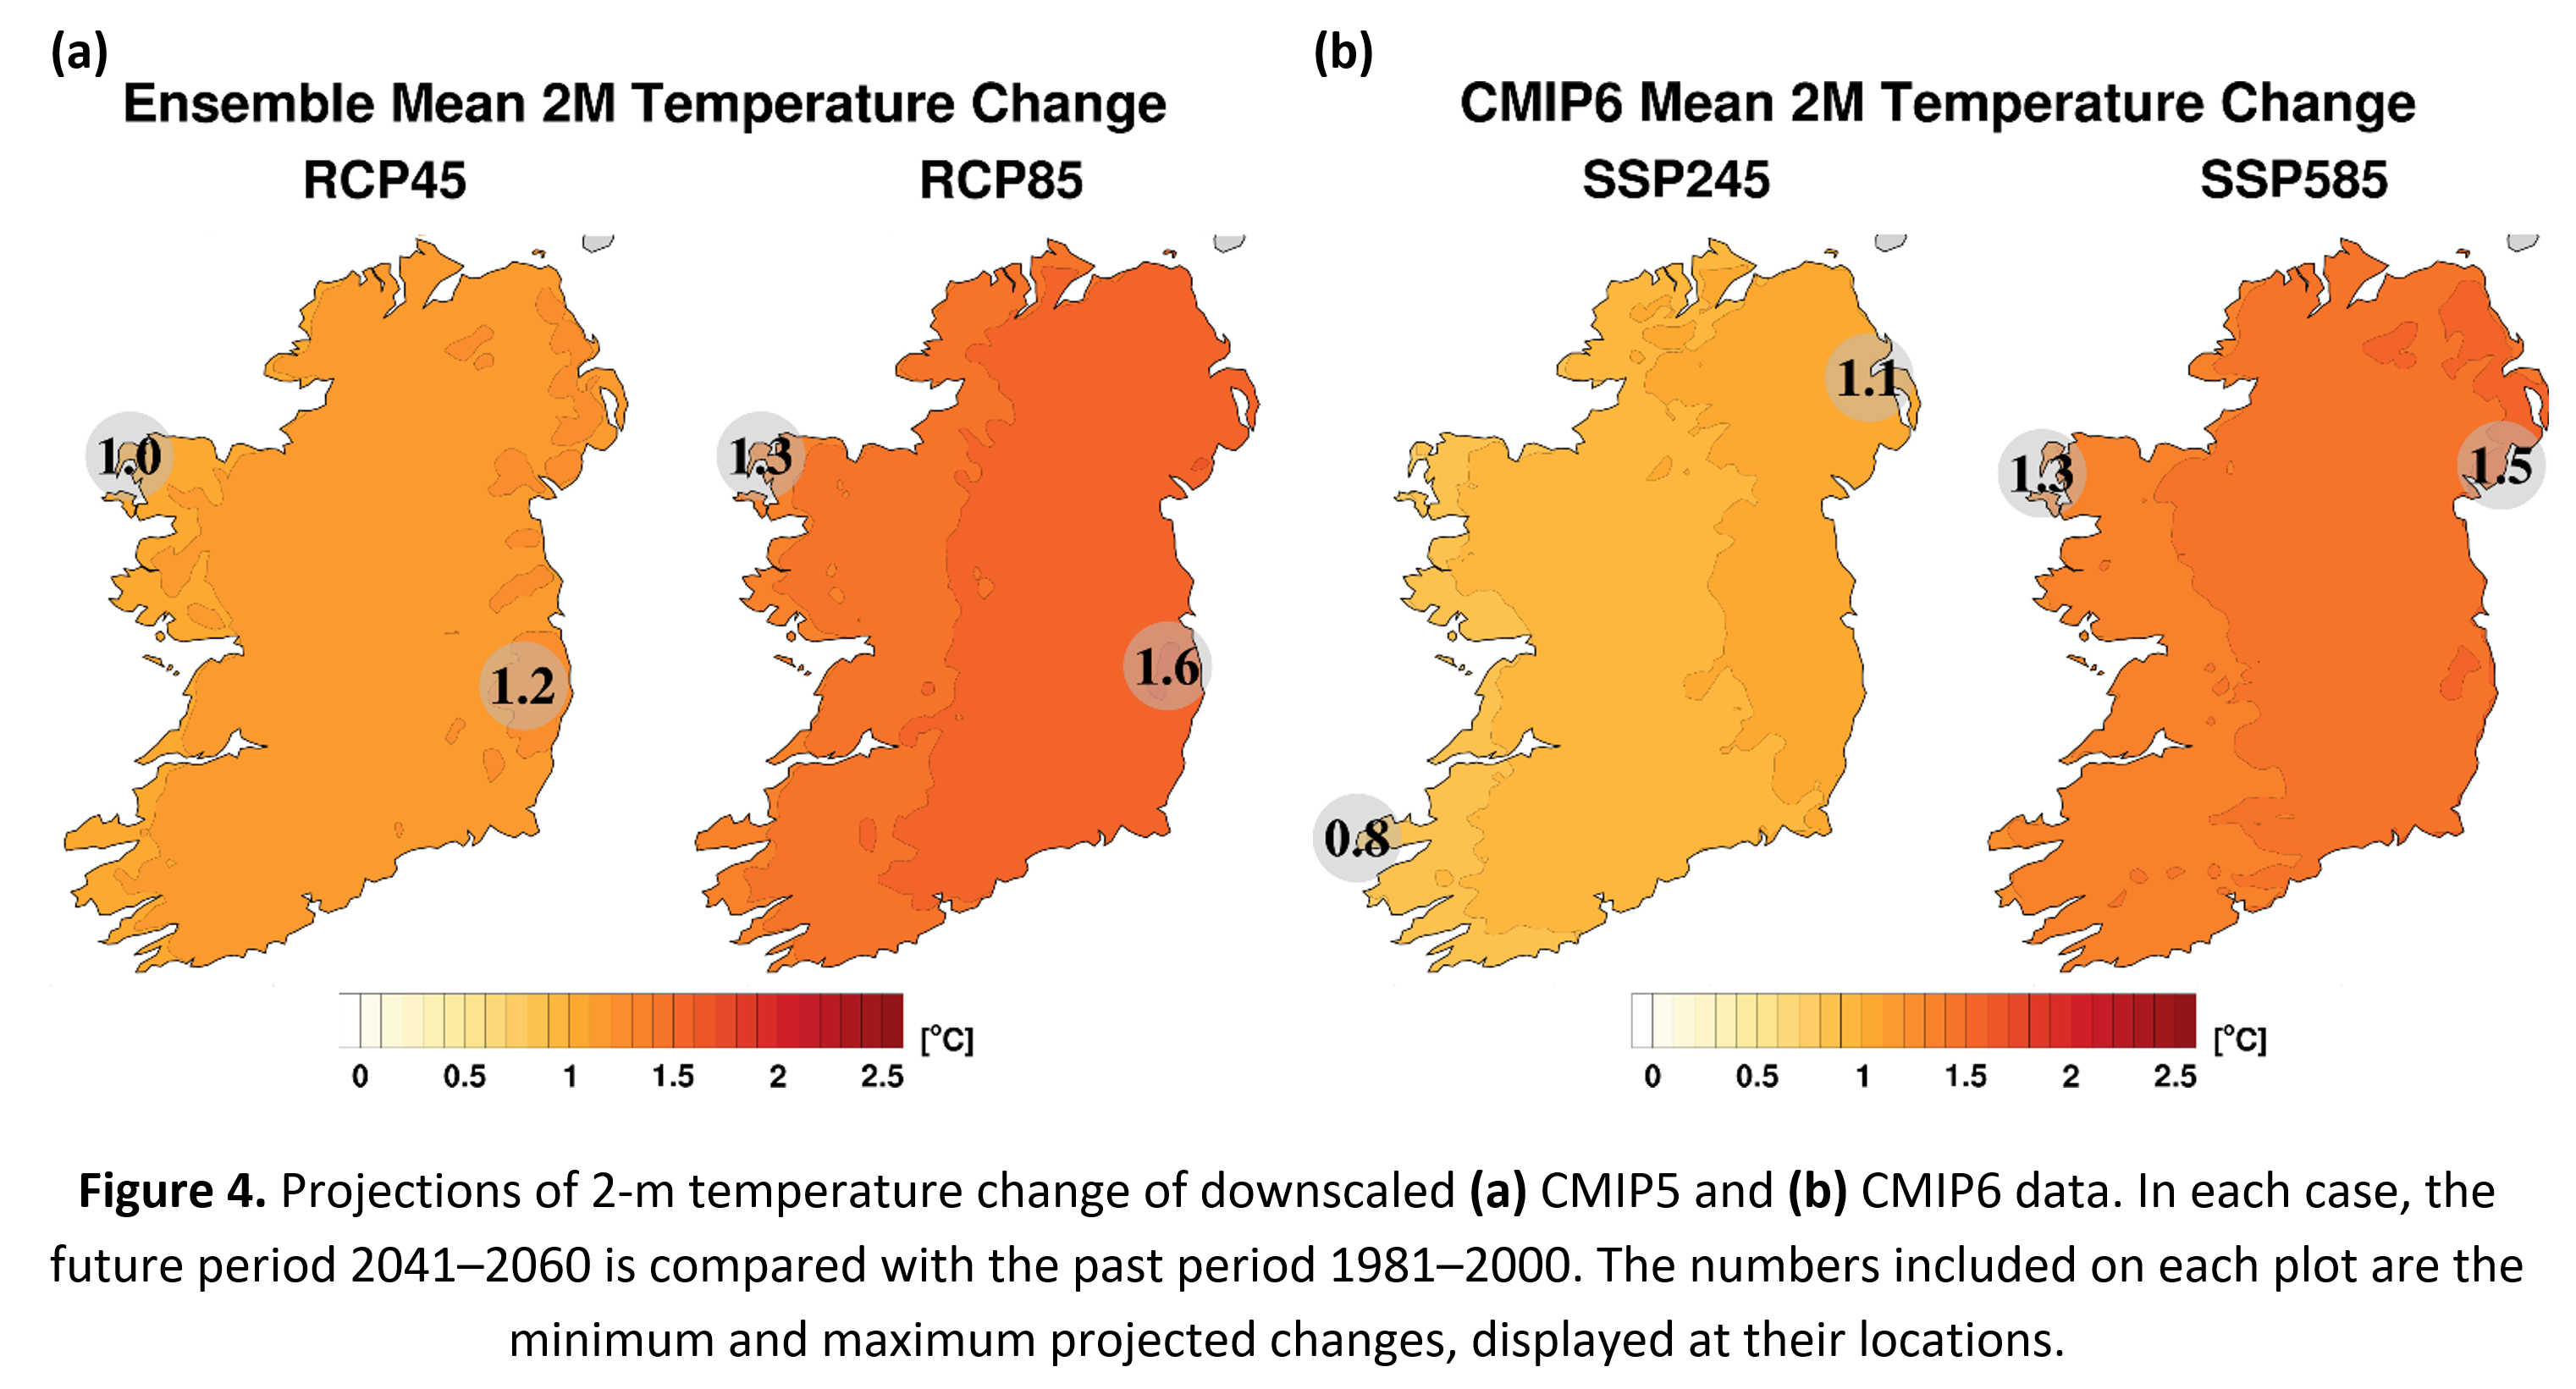
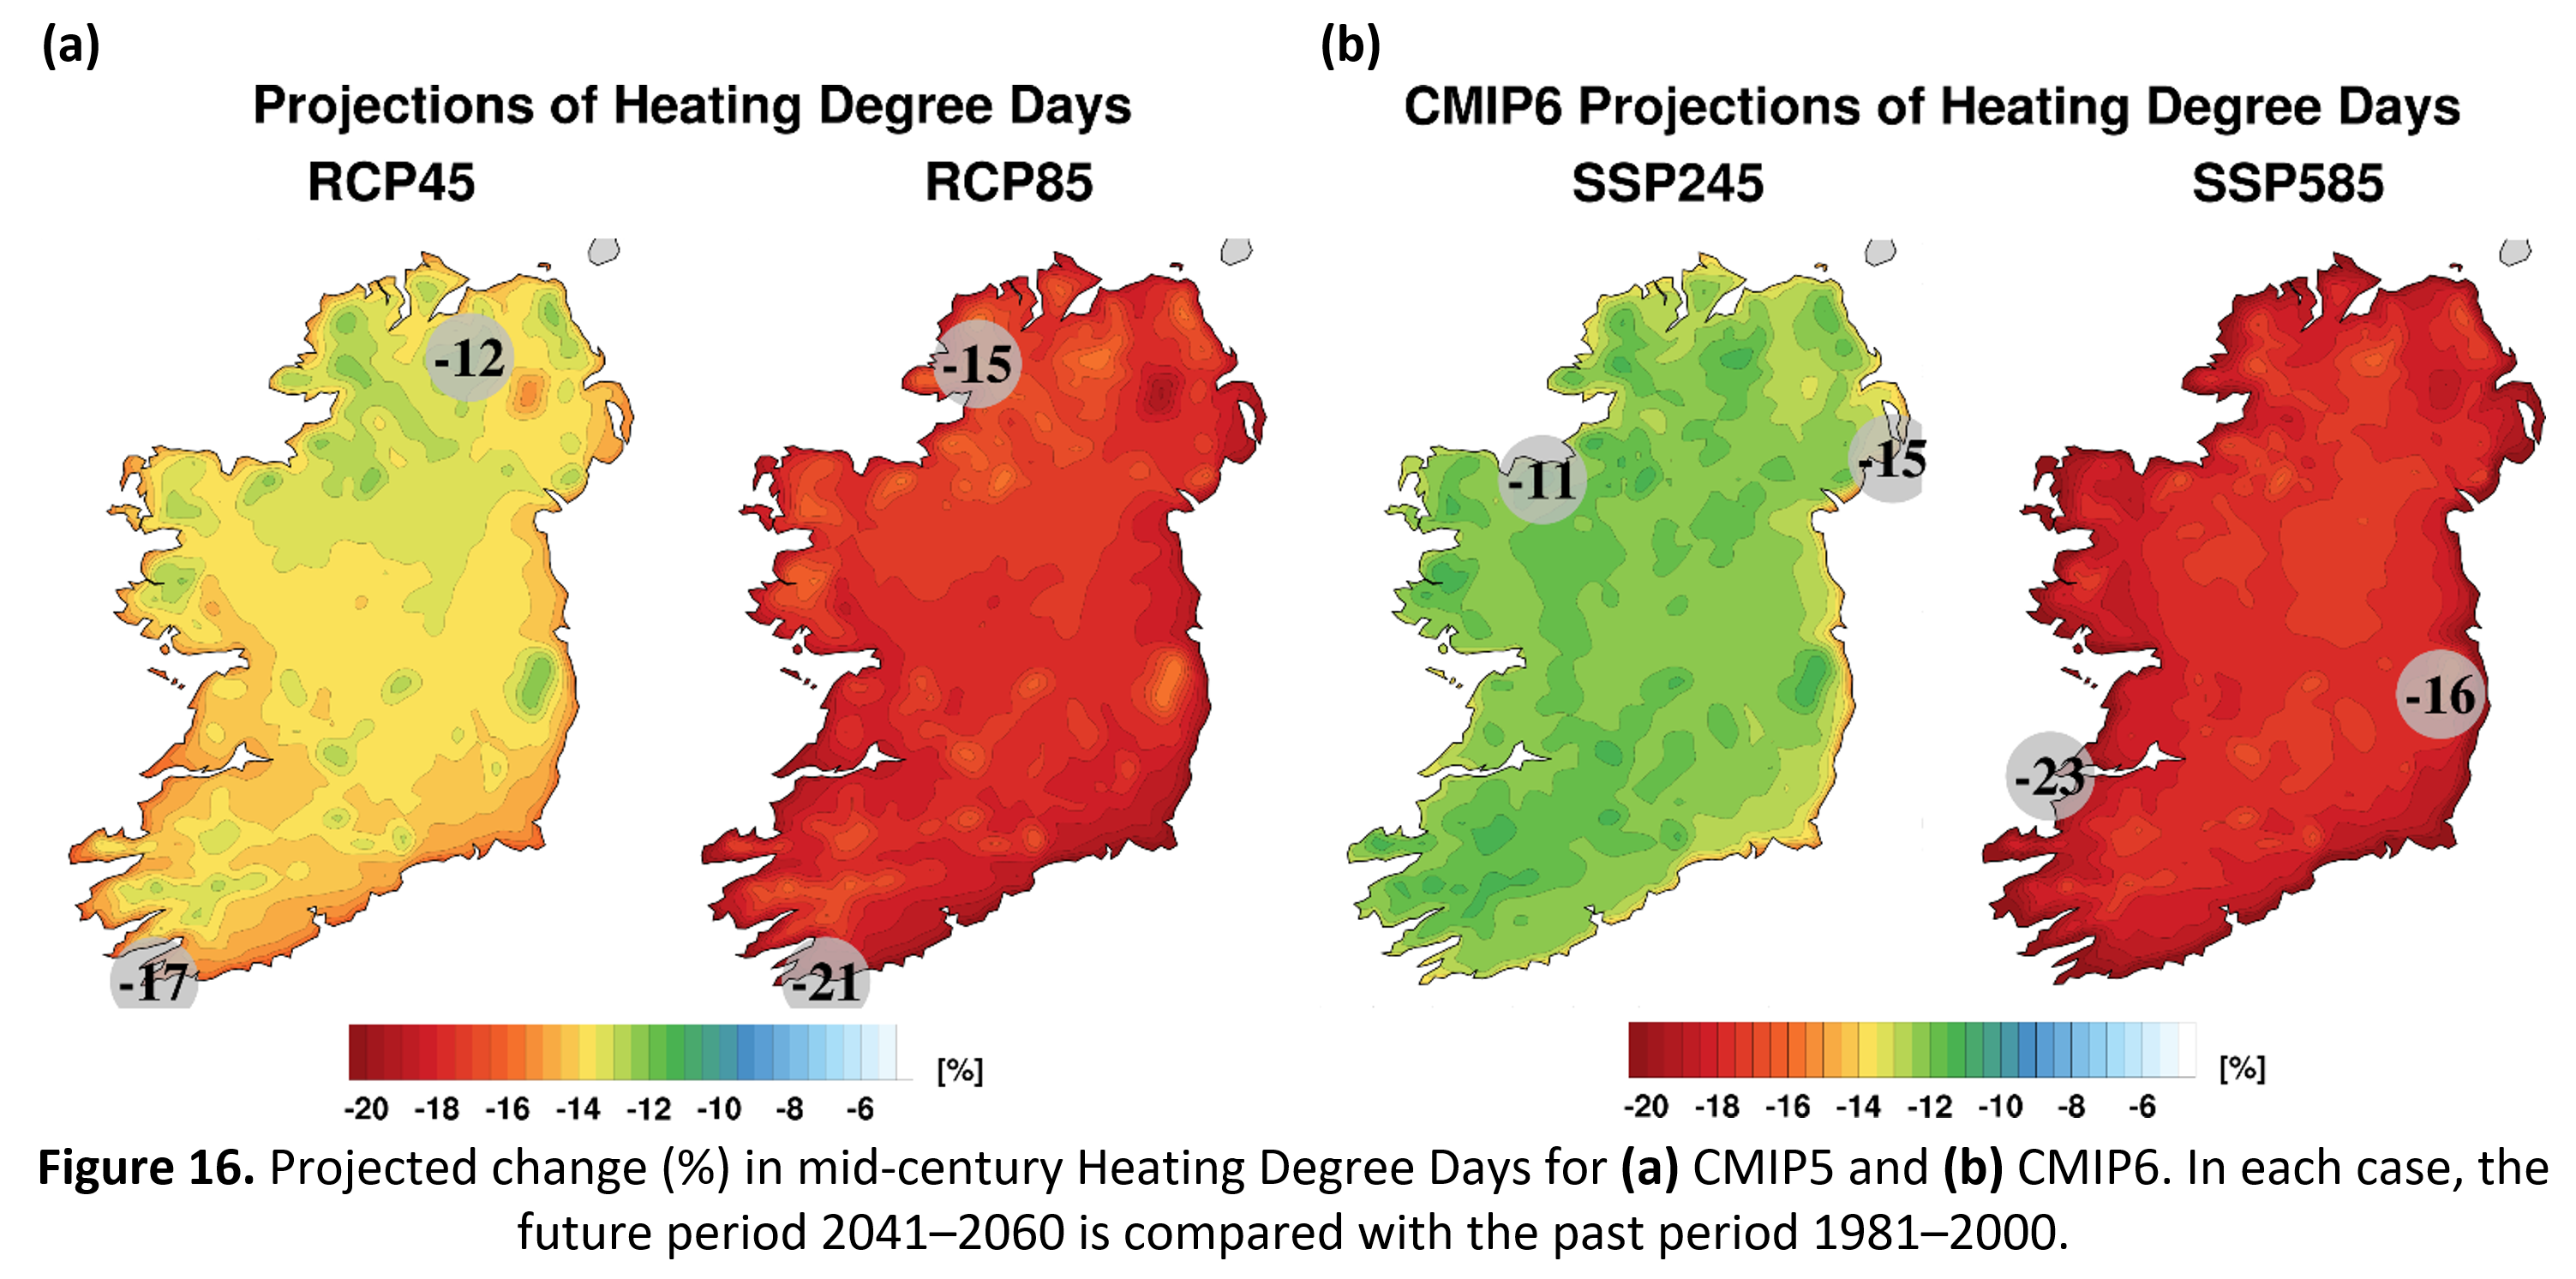
Below we compare downscaled CMIP5 (RCP4.5 & RCP8.5) with CMIP6 (SSP245 and SSP585) projections for the middle of this century (2041–2060 vs. 1981-2000). It is found that for most fields analysed, the downscaled CMIP5 and CMIP6 projections are similar. This agreement adds a measure of confidence to the projections.
- The mid-century downscaled CMIP5 and CMIP6 temperature projections both exhibit a west-to-east temperature change gradient (Figure 4);
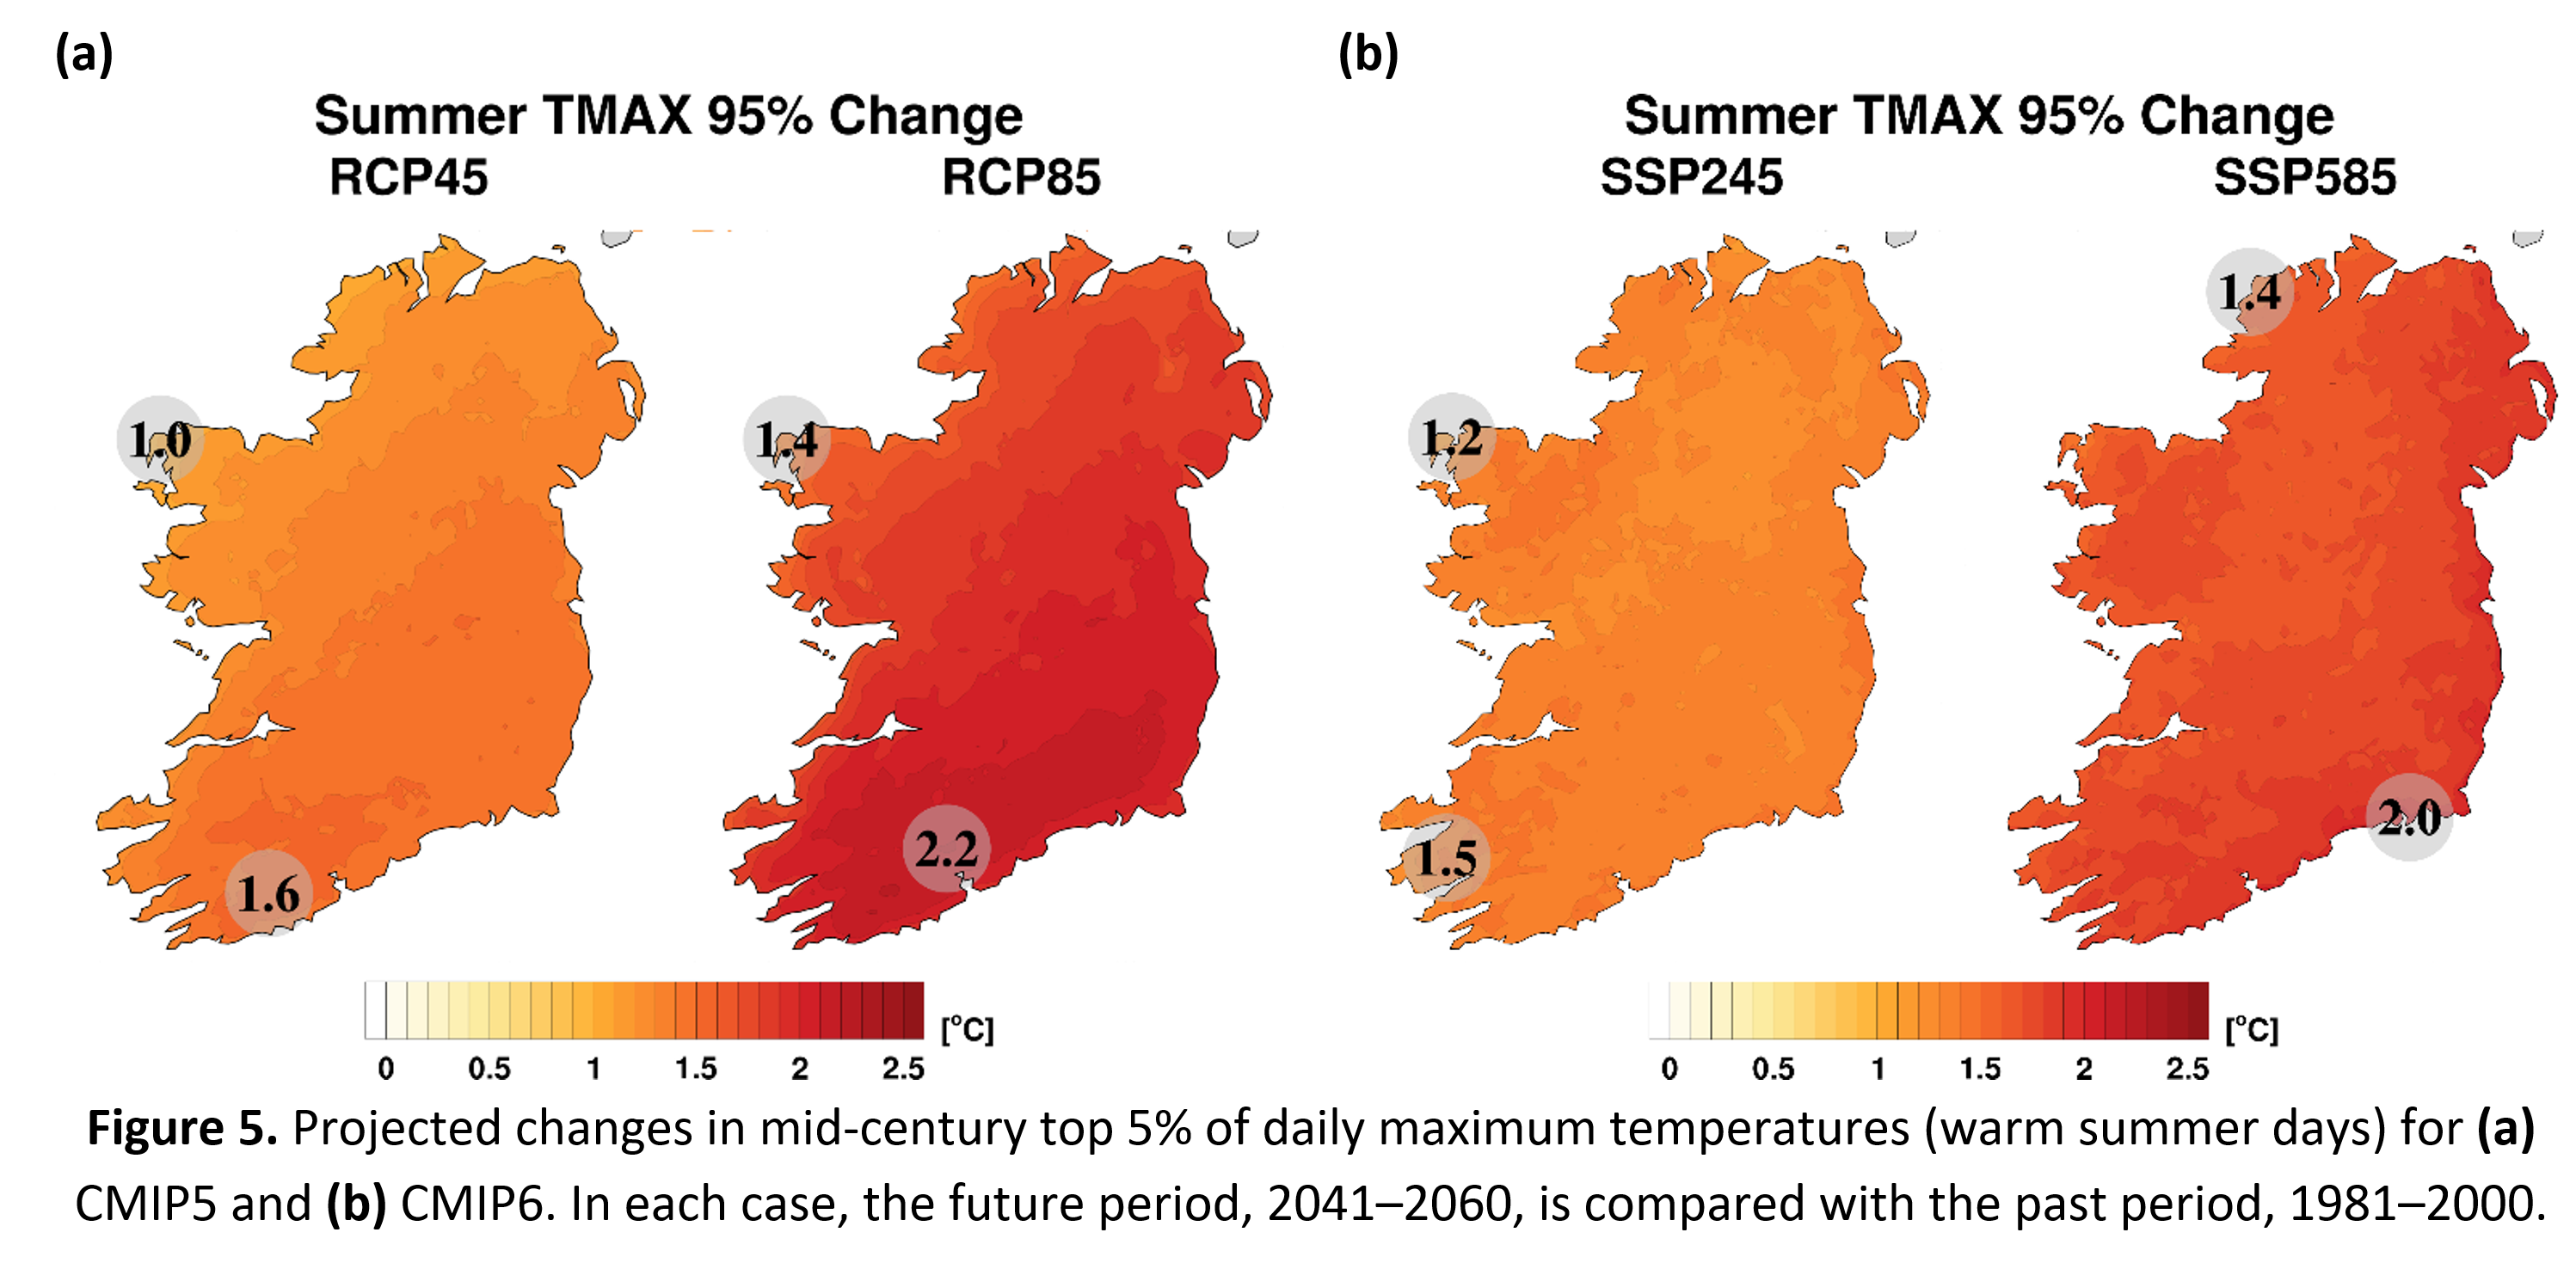
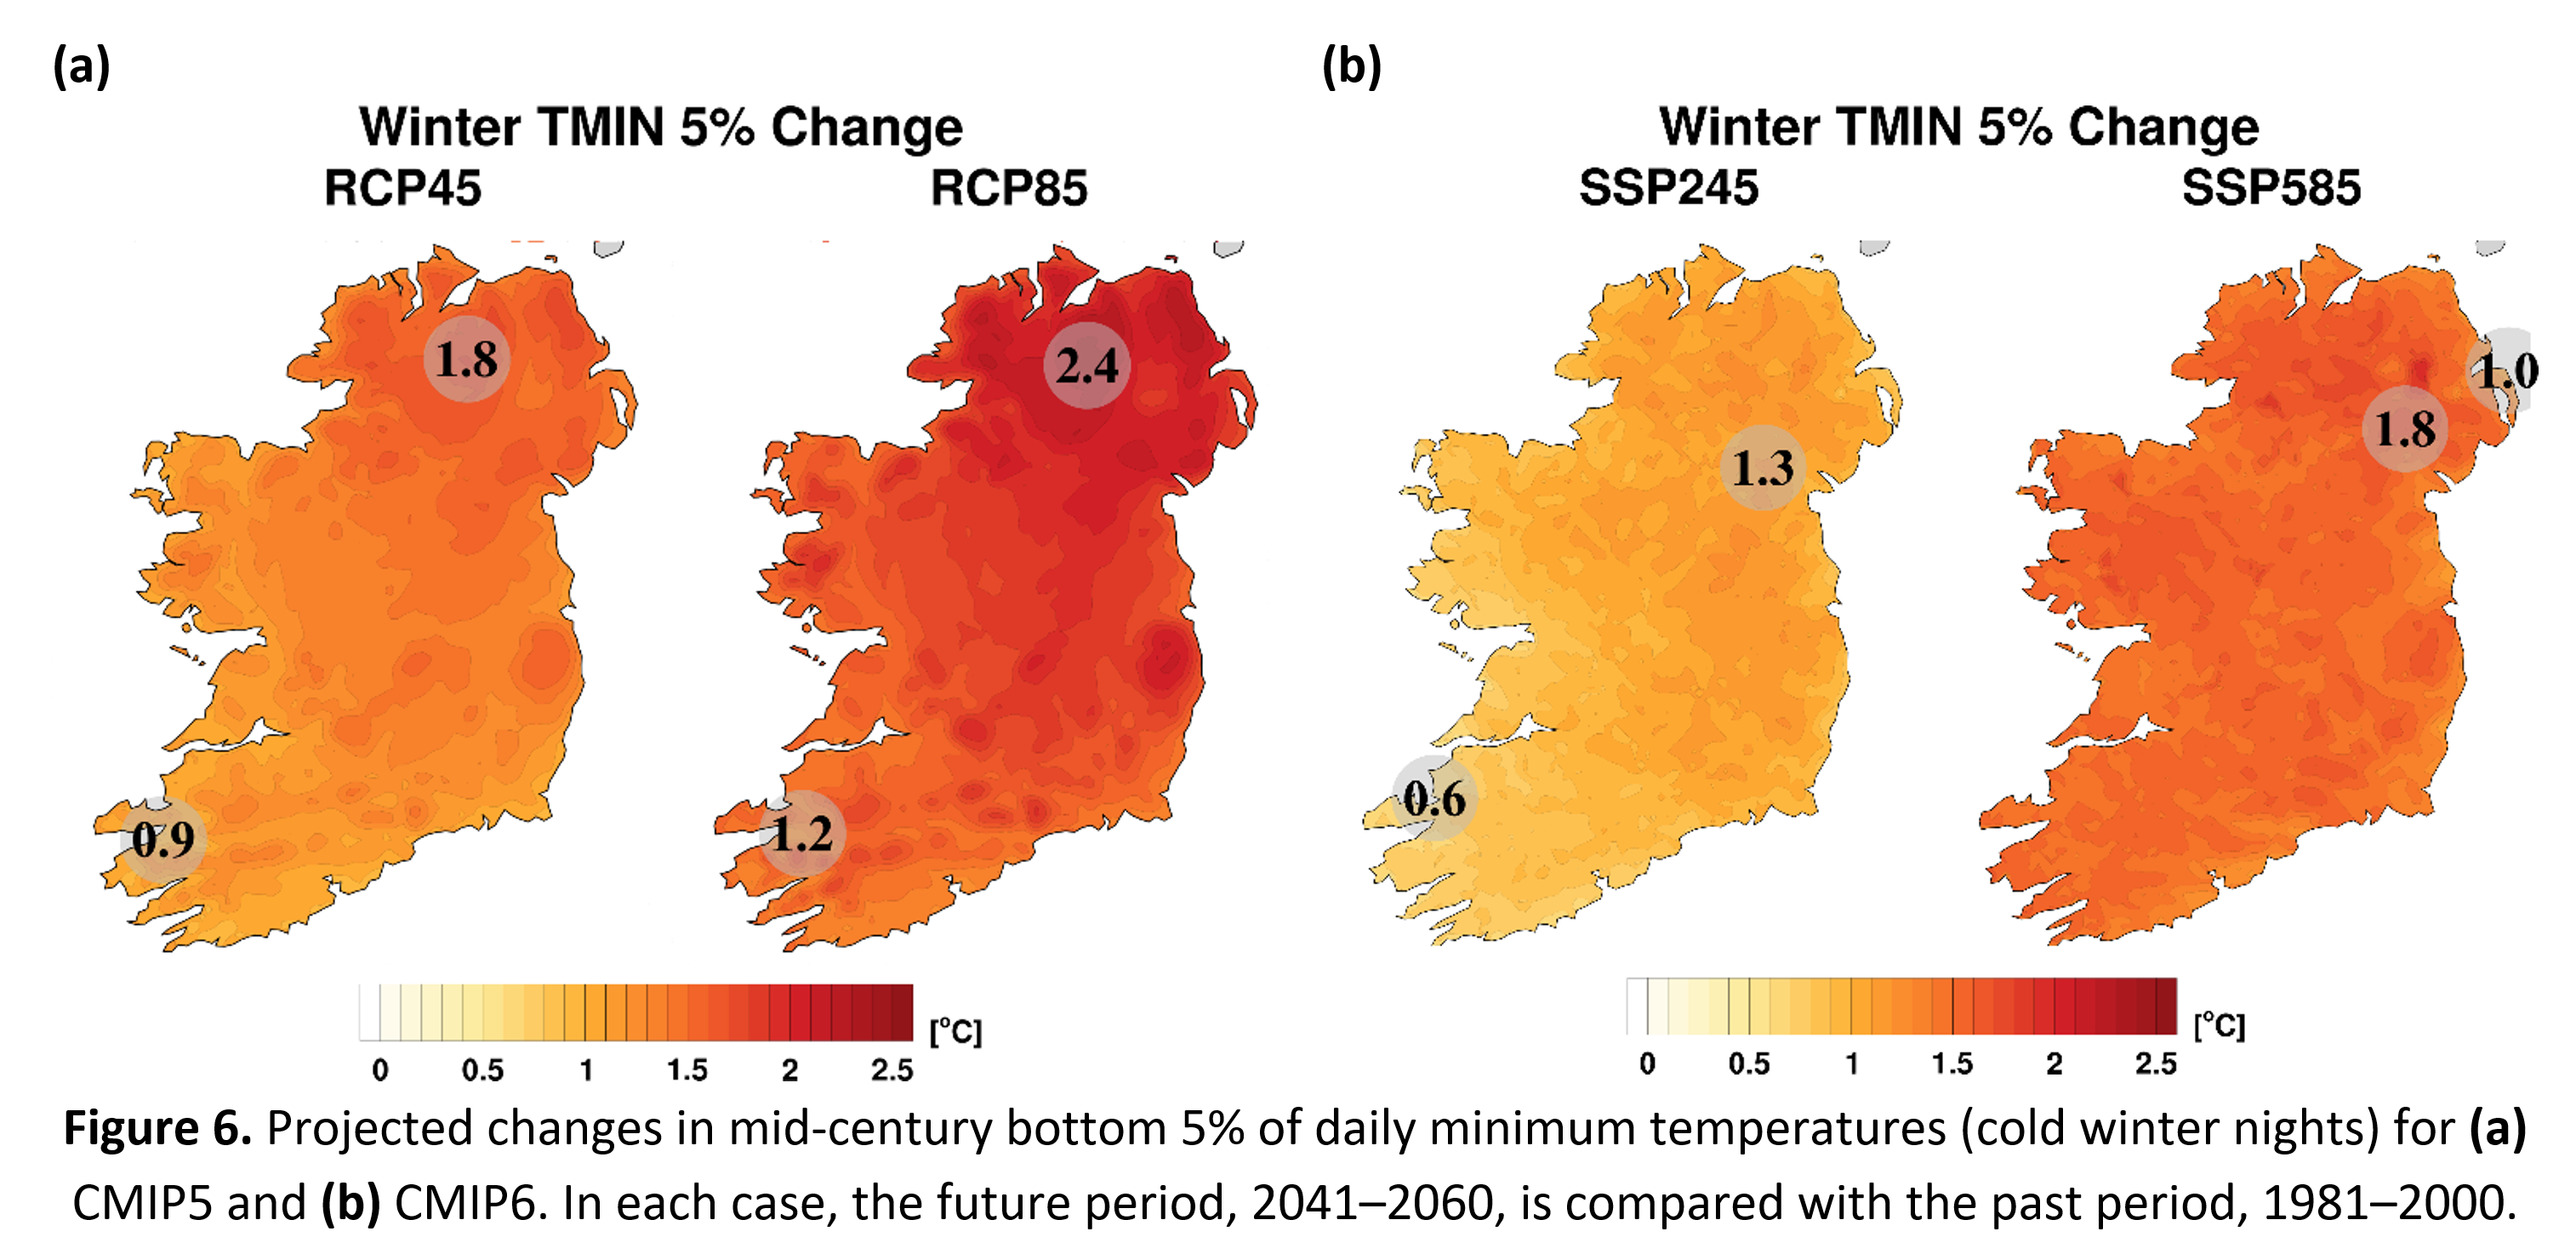
- warming is enhanced at the extremes (i.e., hot days and cold nights) for both CMIP5 & CMIP6 with projections of summer daytime (Figure 5) and winter night-time (Figure 6) temperatures being greater than the mean increase of Figure 4.
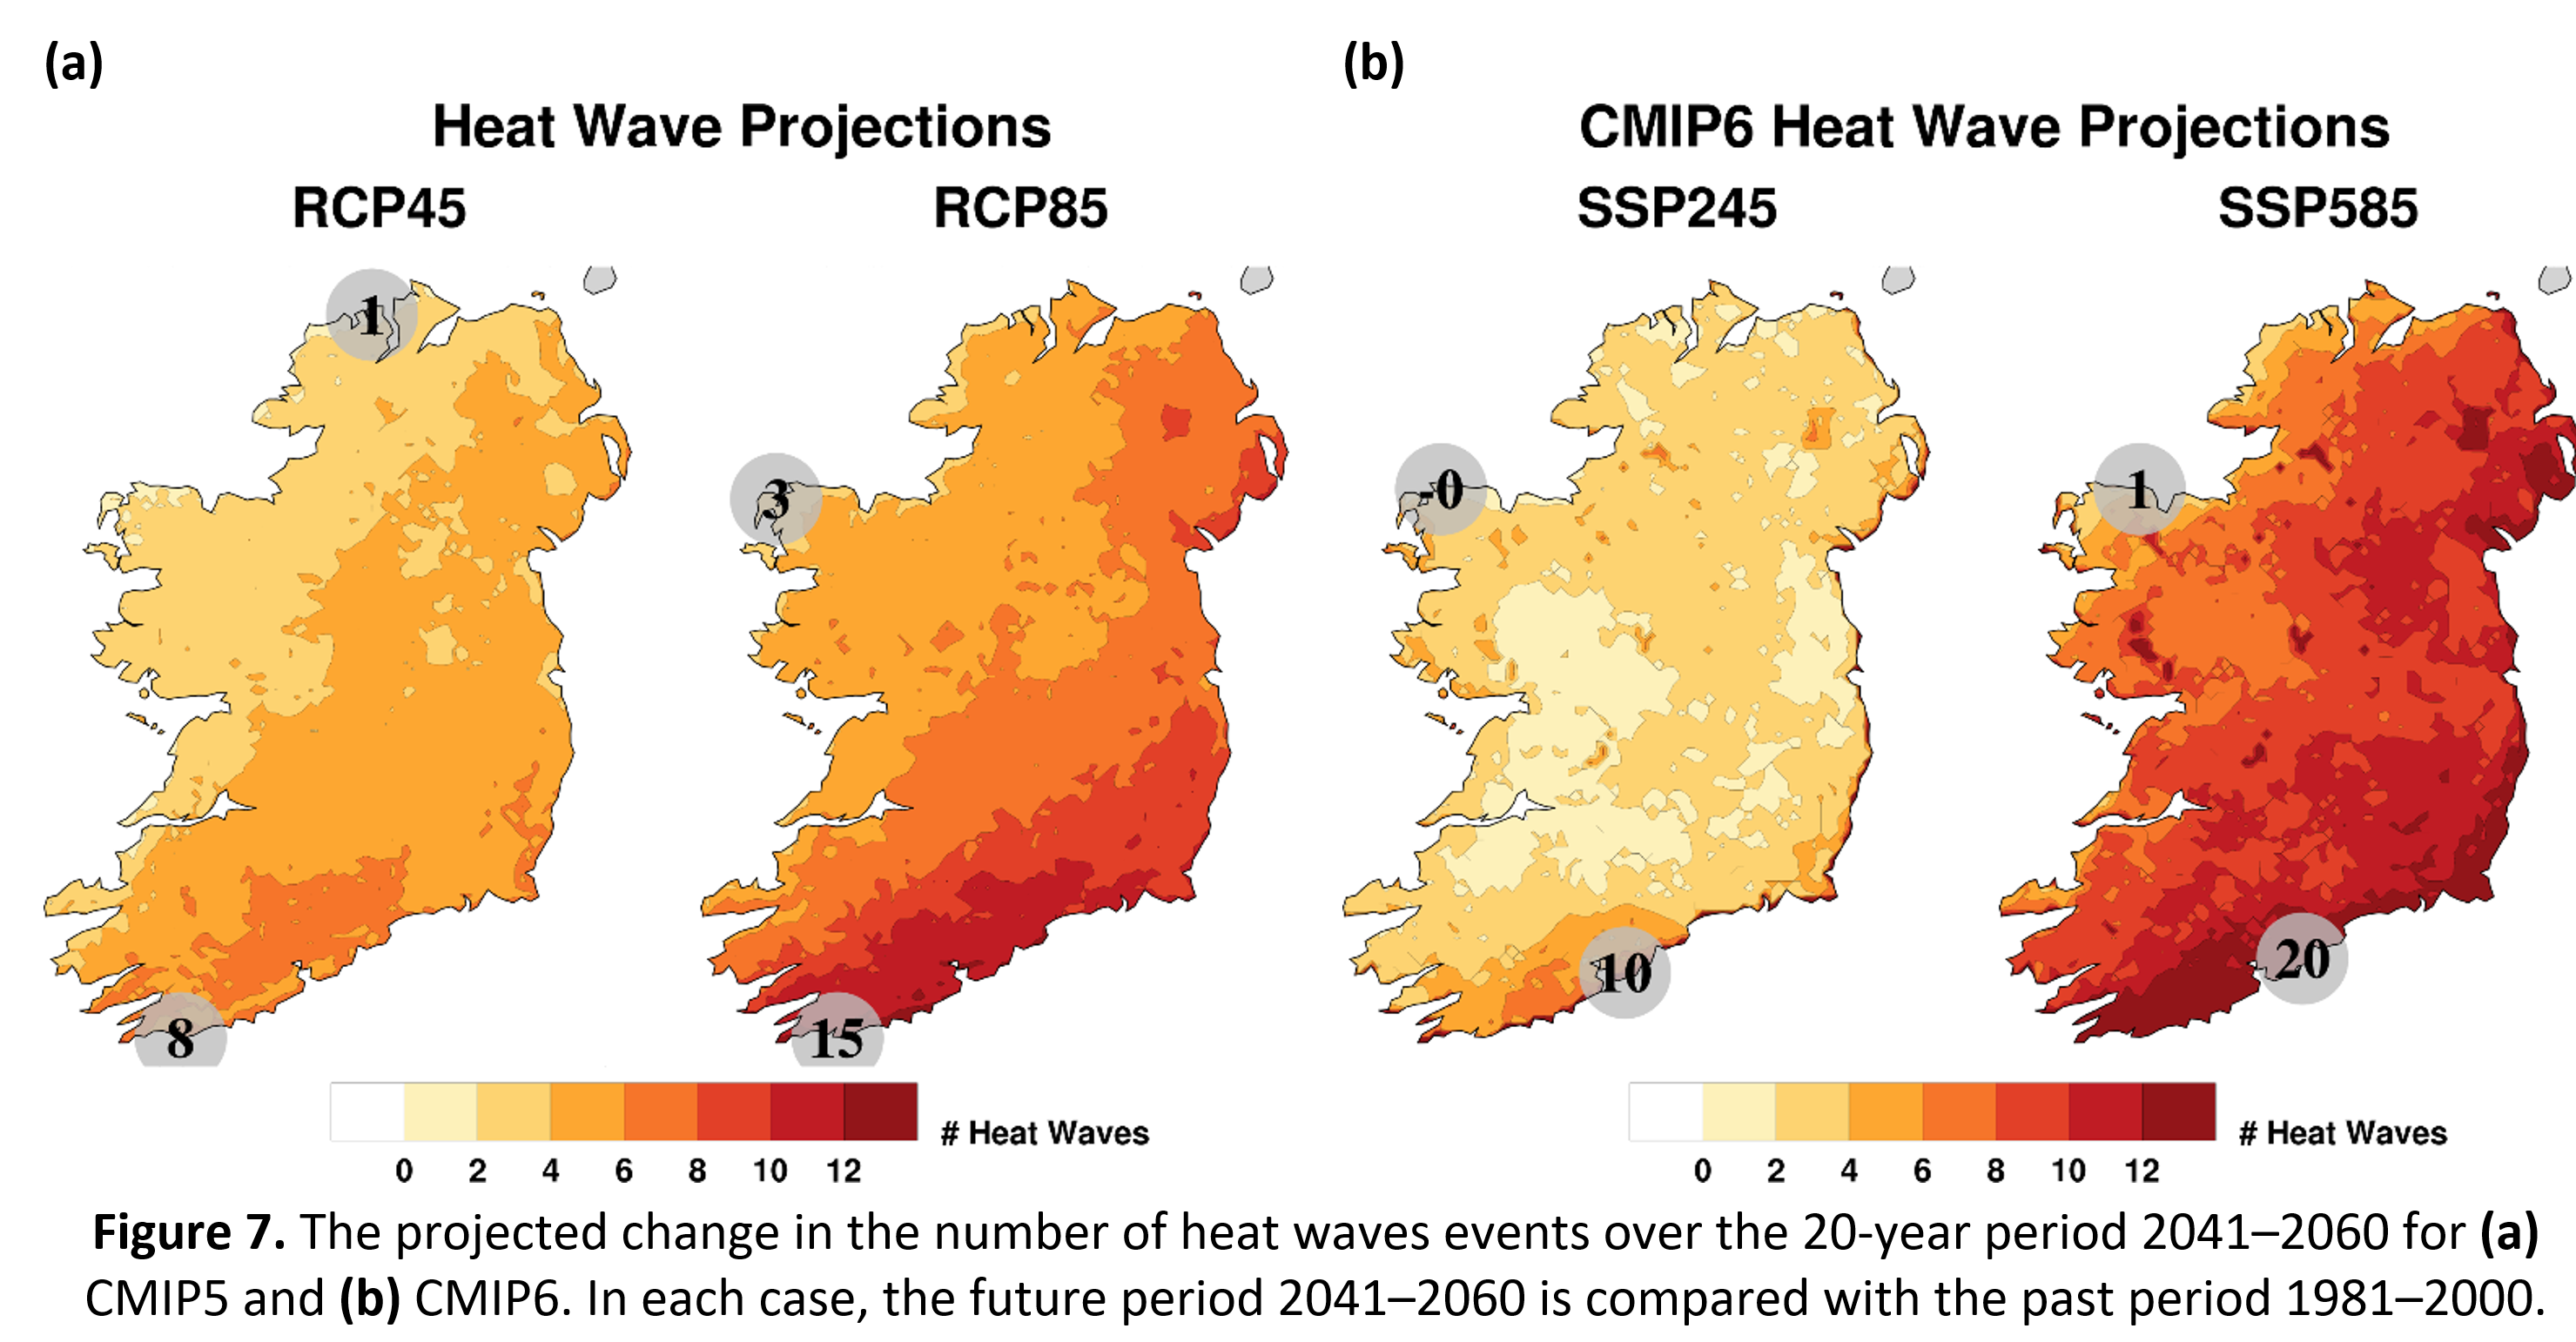
- summer heatwave events are expected to occur more frequently, with the largest increases in the south for both CMIP5 and CMIP6 (Figure 7);
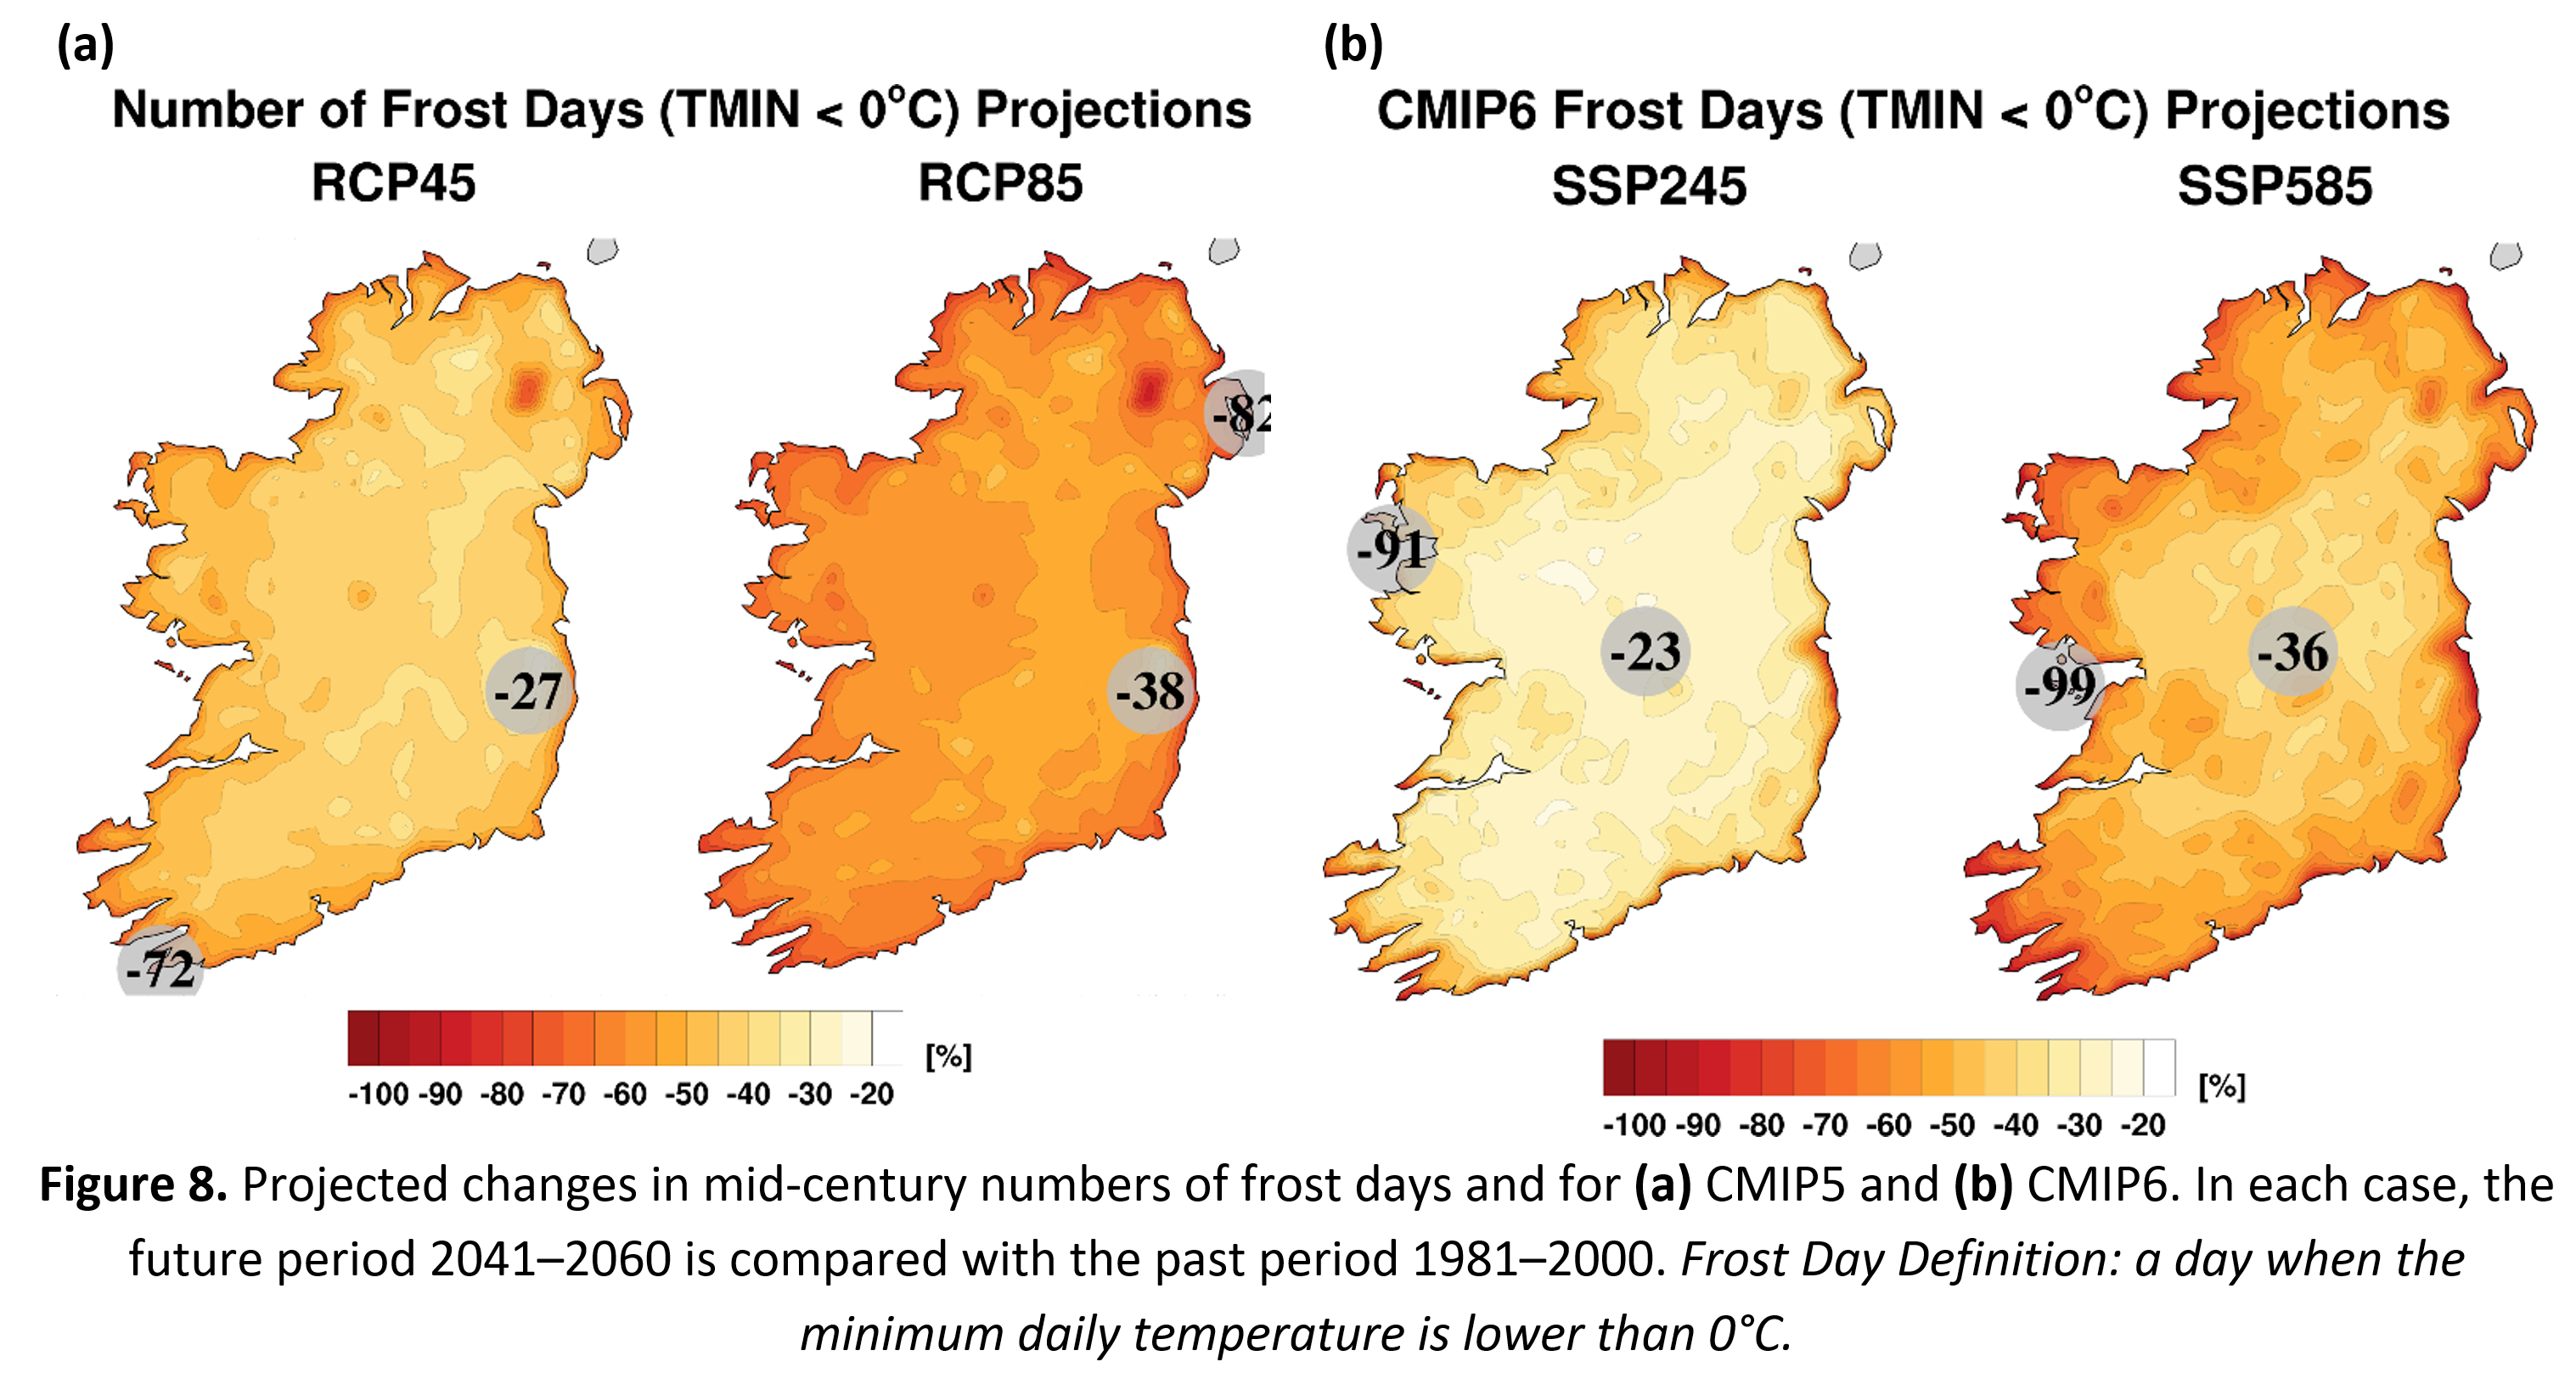
- substantial decreases of approximately 50% are projected in the number of frost days (Figure 8) for both CMIP5&6 data.
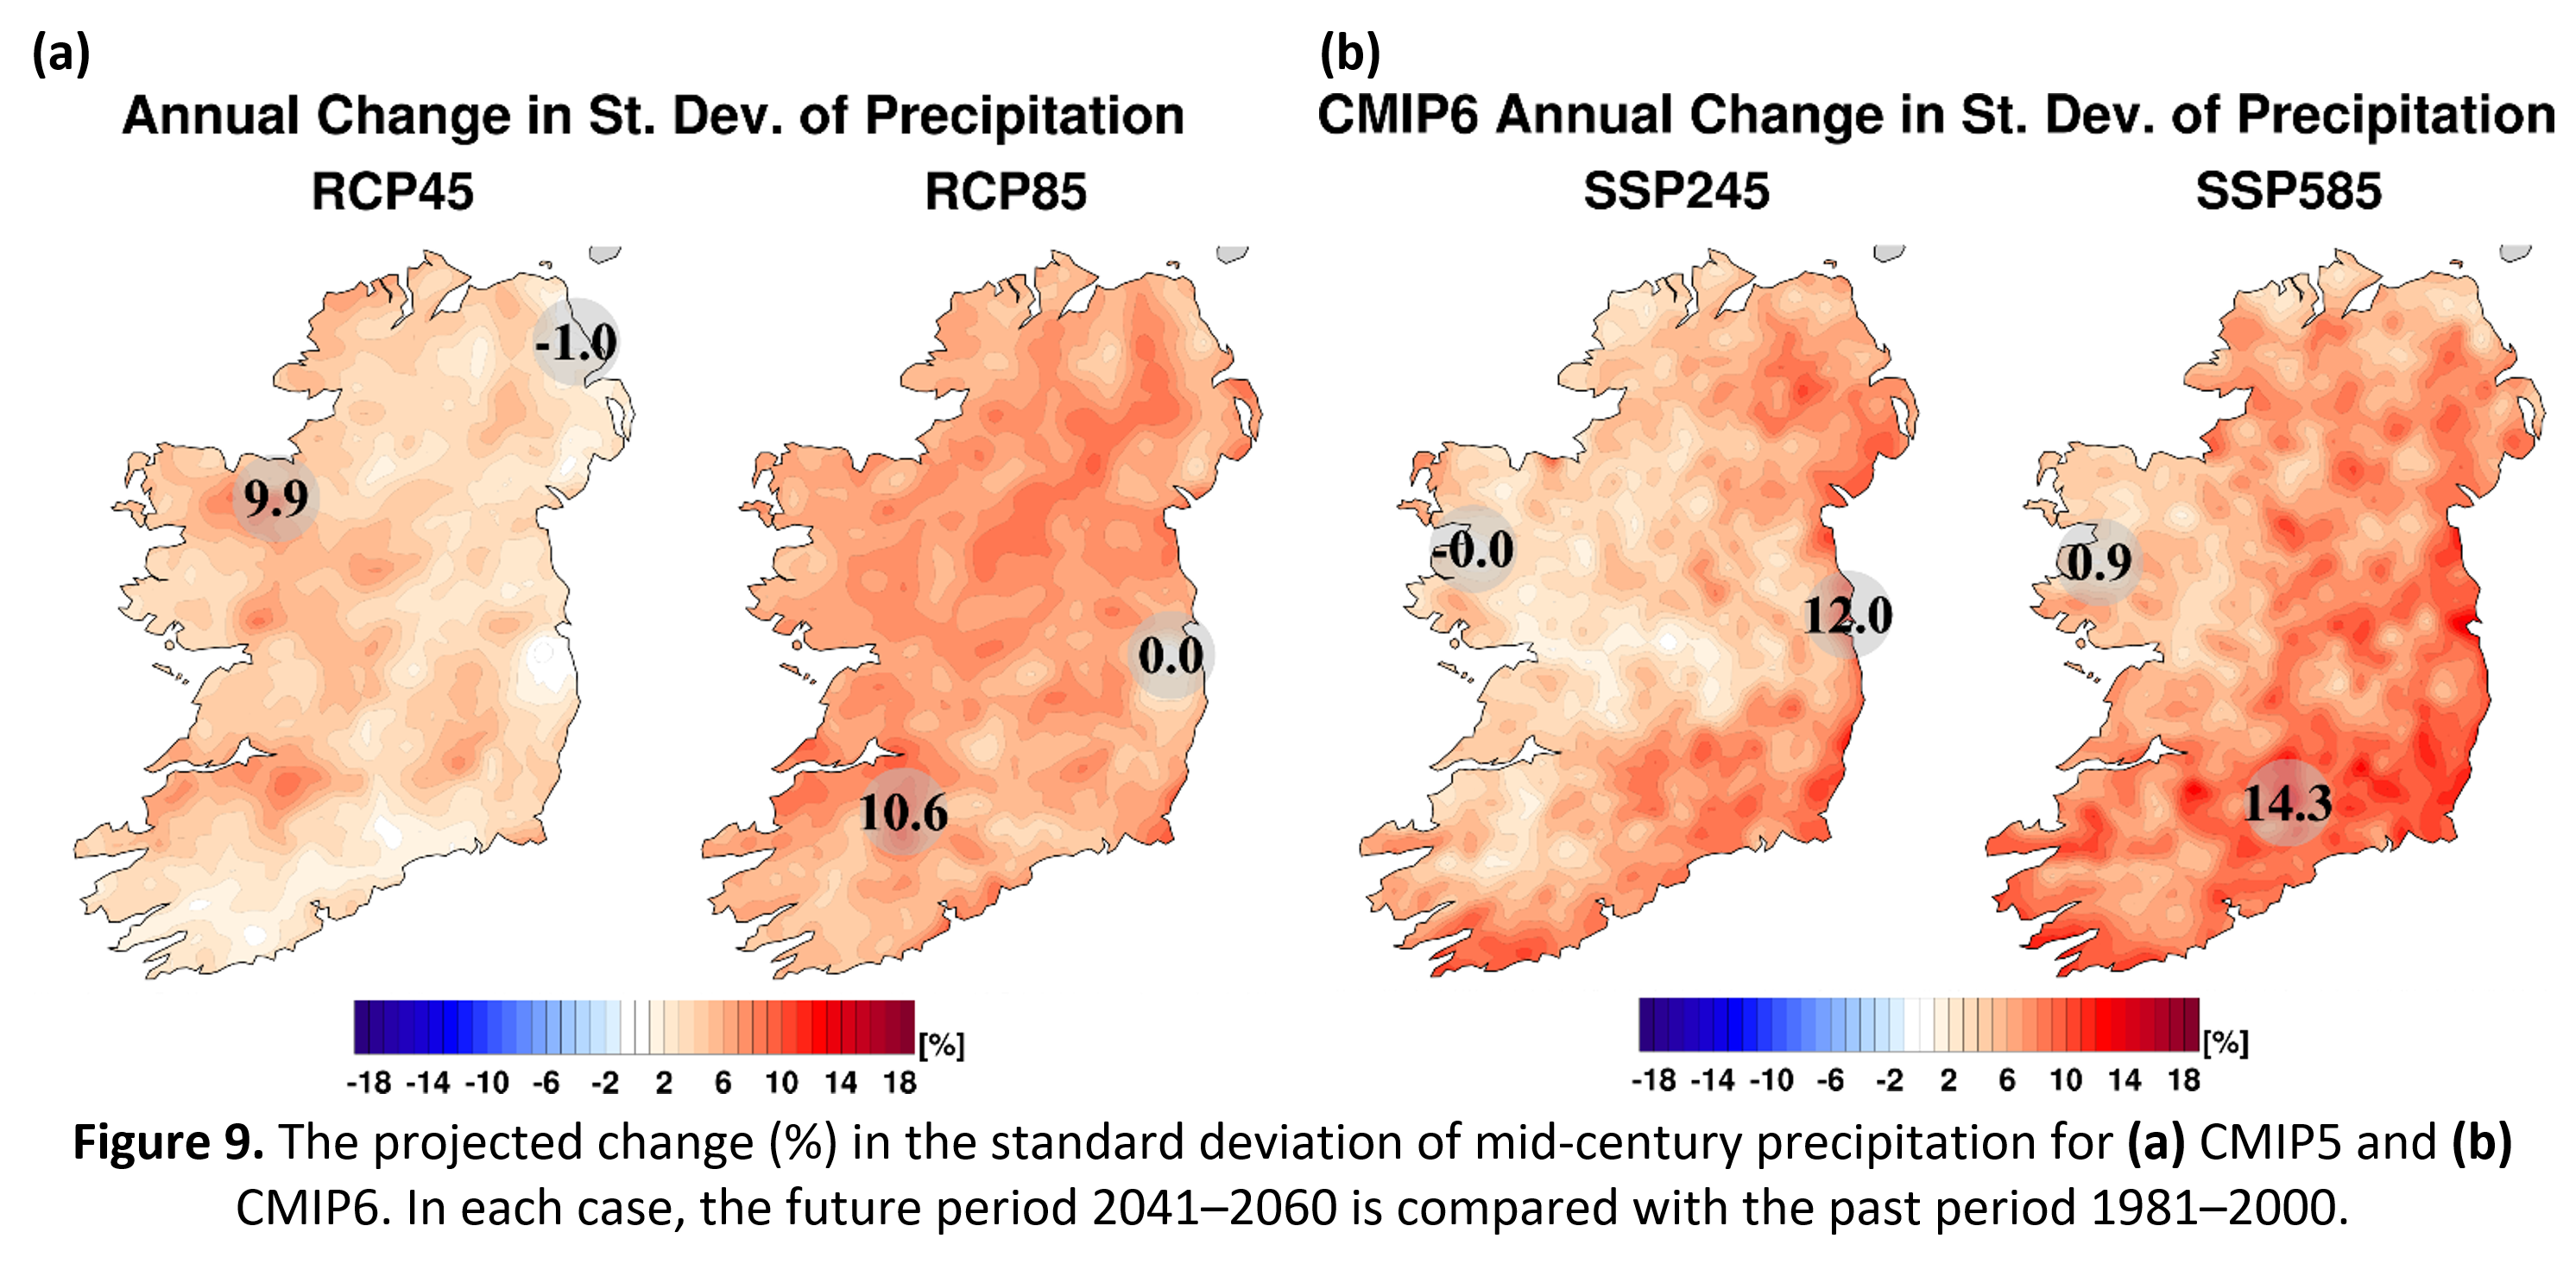
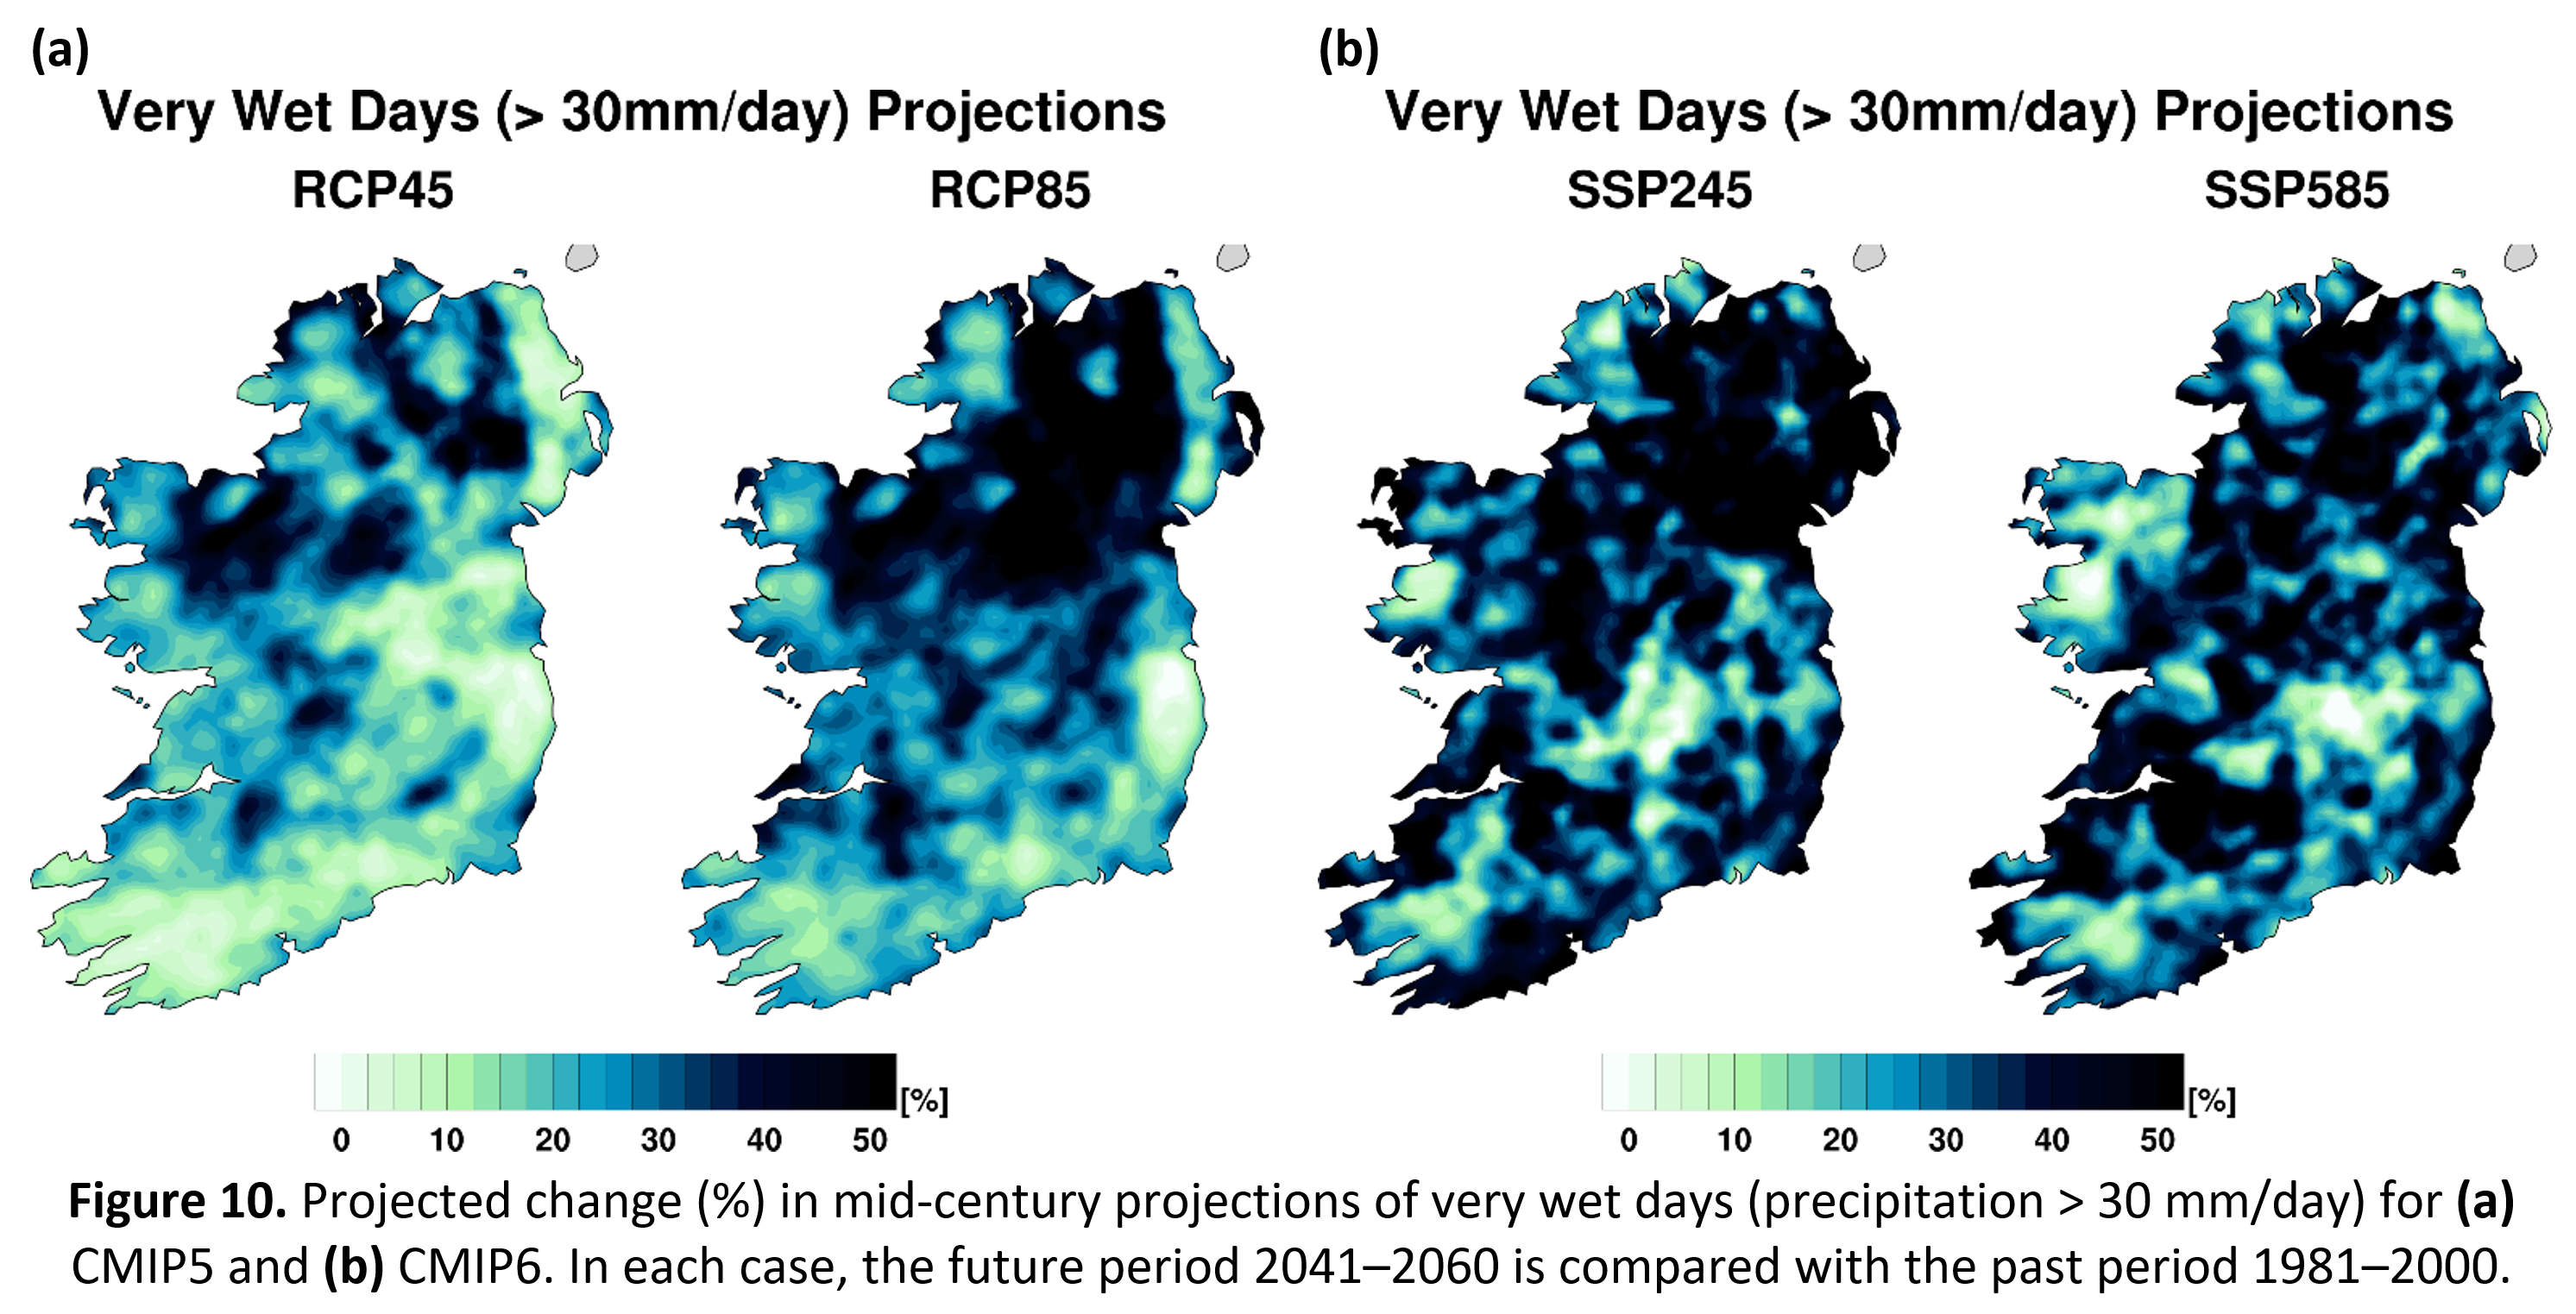
- the precipitation climate is expected to become more variable (Figure 9), with substantial projected increases in the occurrence of both dry periods and heavy precipitation events (Figure 10). Note that for precipitation, the CMIP6 ensemble size will need to be increased substantially before a level of confidence can be assigned to the projections.
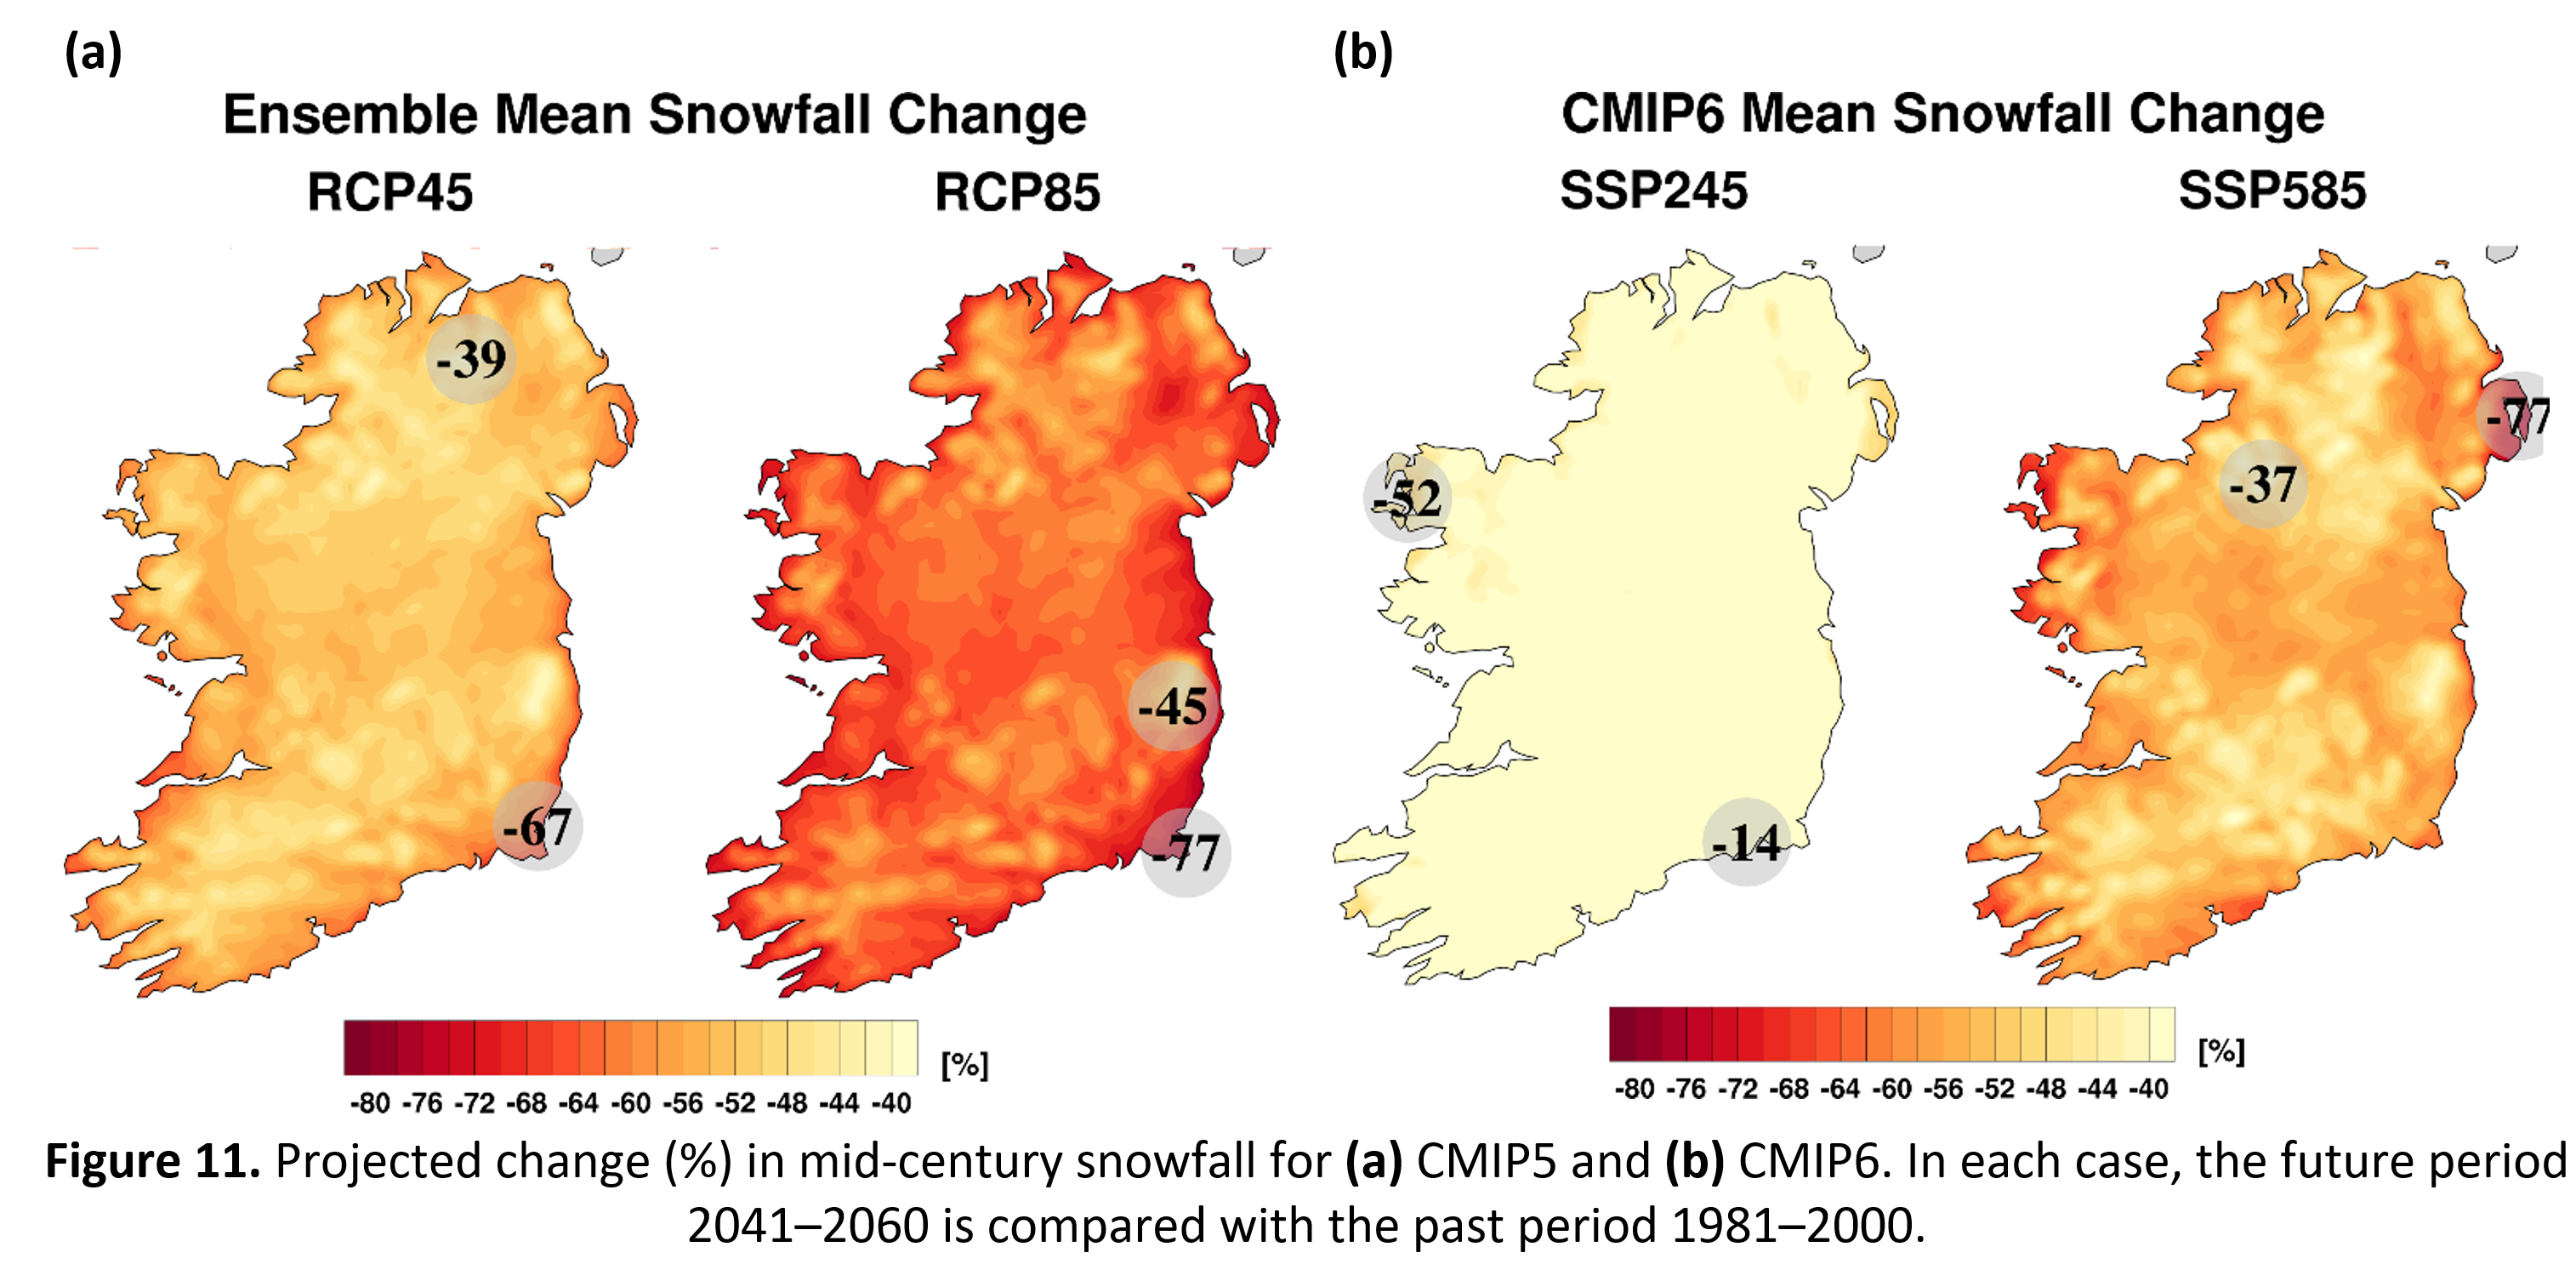
- Snowfall is projected to decrease substantially by the middle of the century with reductions of over 30% for both CMIP5&6 (Figure 11).
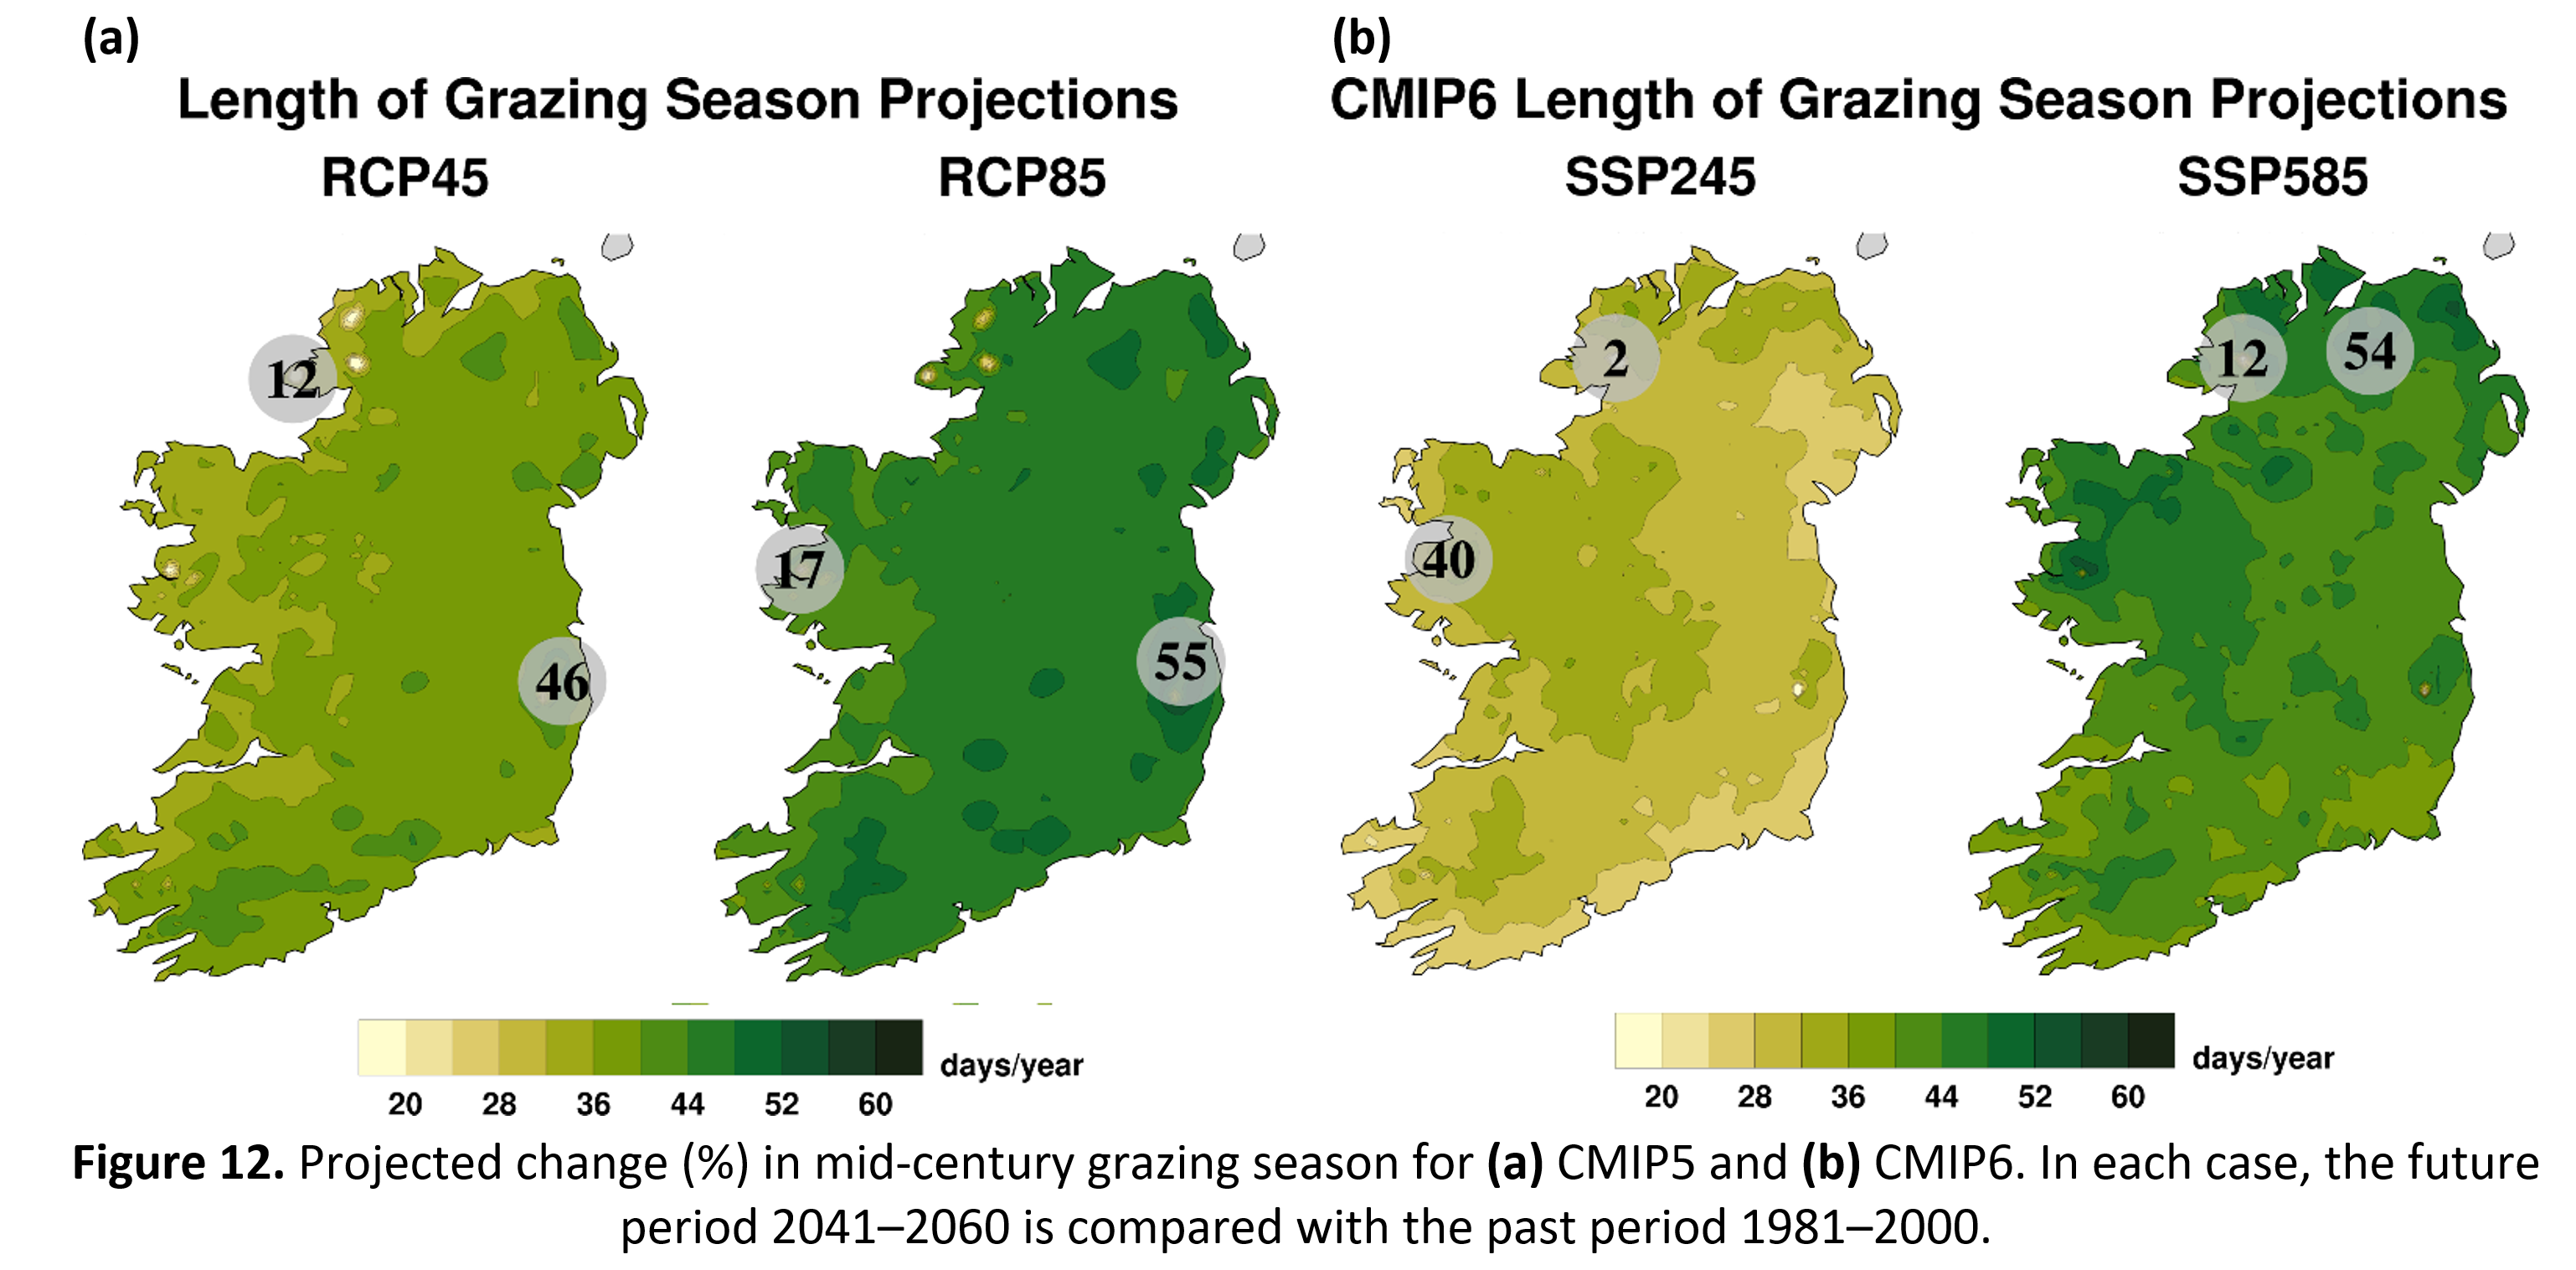
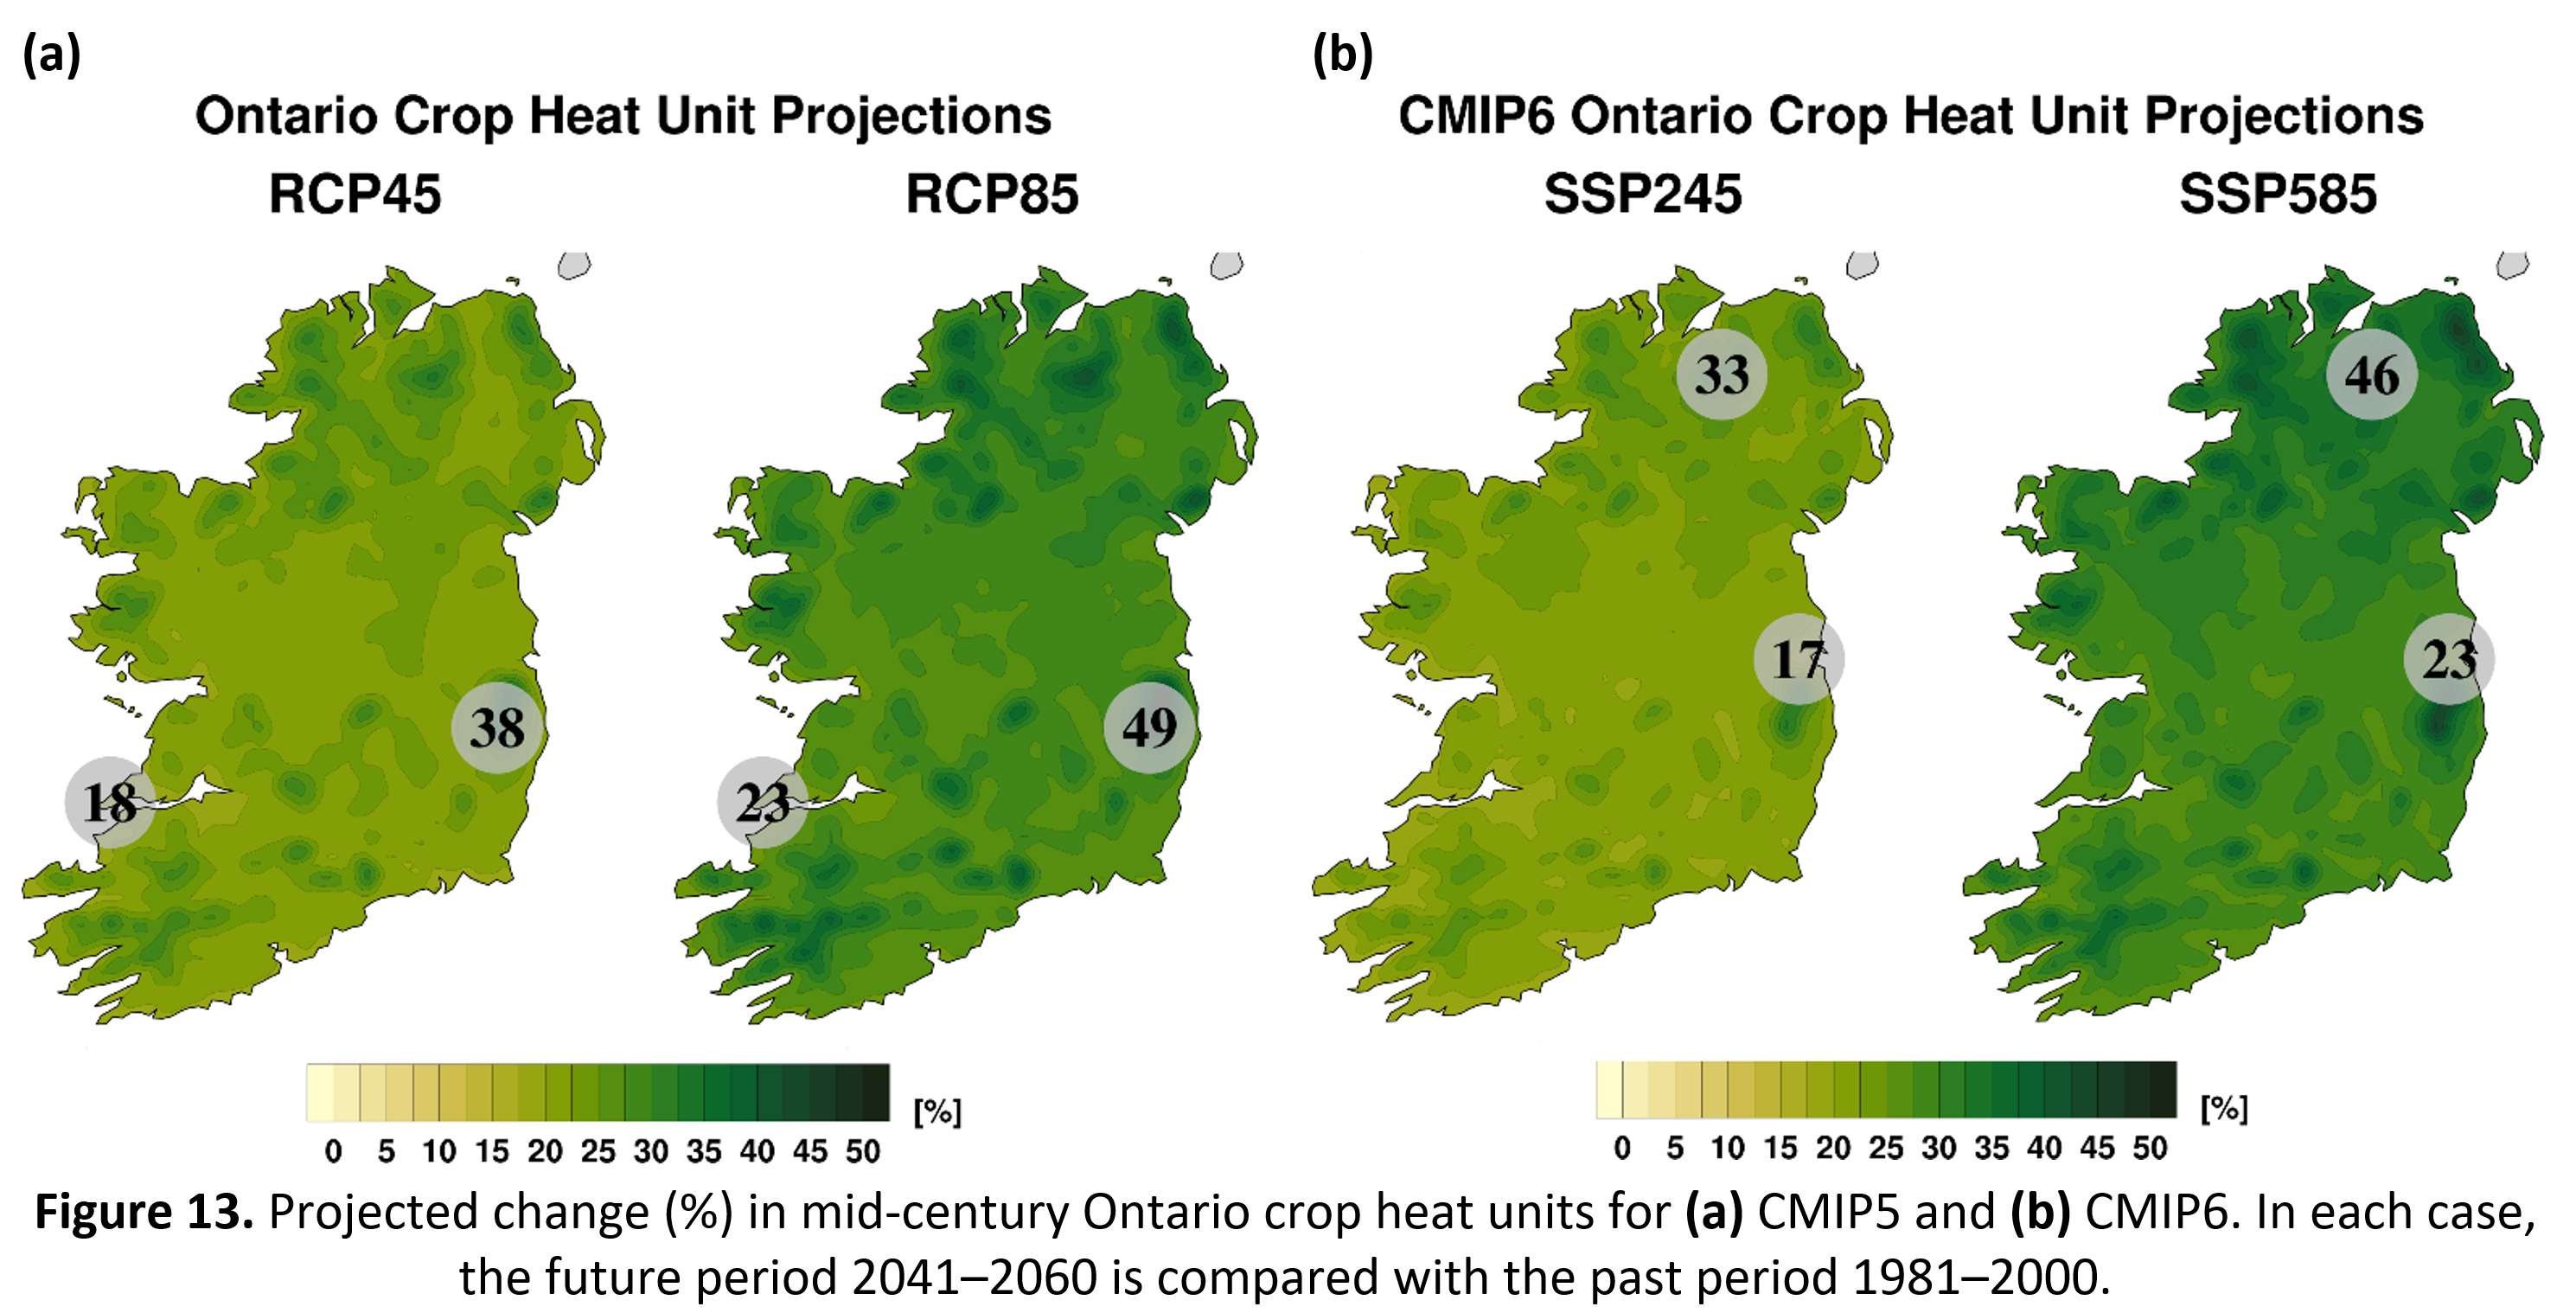
- the length of the grazing season is projected to increase substantially by mid-century (Figure 12). Similarly, the growing season, ‘Ontario crop heat units’ (Figure 13) and growing degree days (GDDs) for a range of crops (and pests) are projected to increase substantially by the middle of the century.
- The 10m wind speed (Figure 14) and energy content of the 120 m (turbine height) wind is projected to decrease for all seasons with the largest decreases noted for summer.
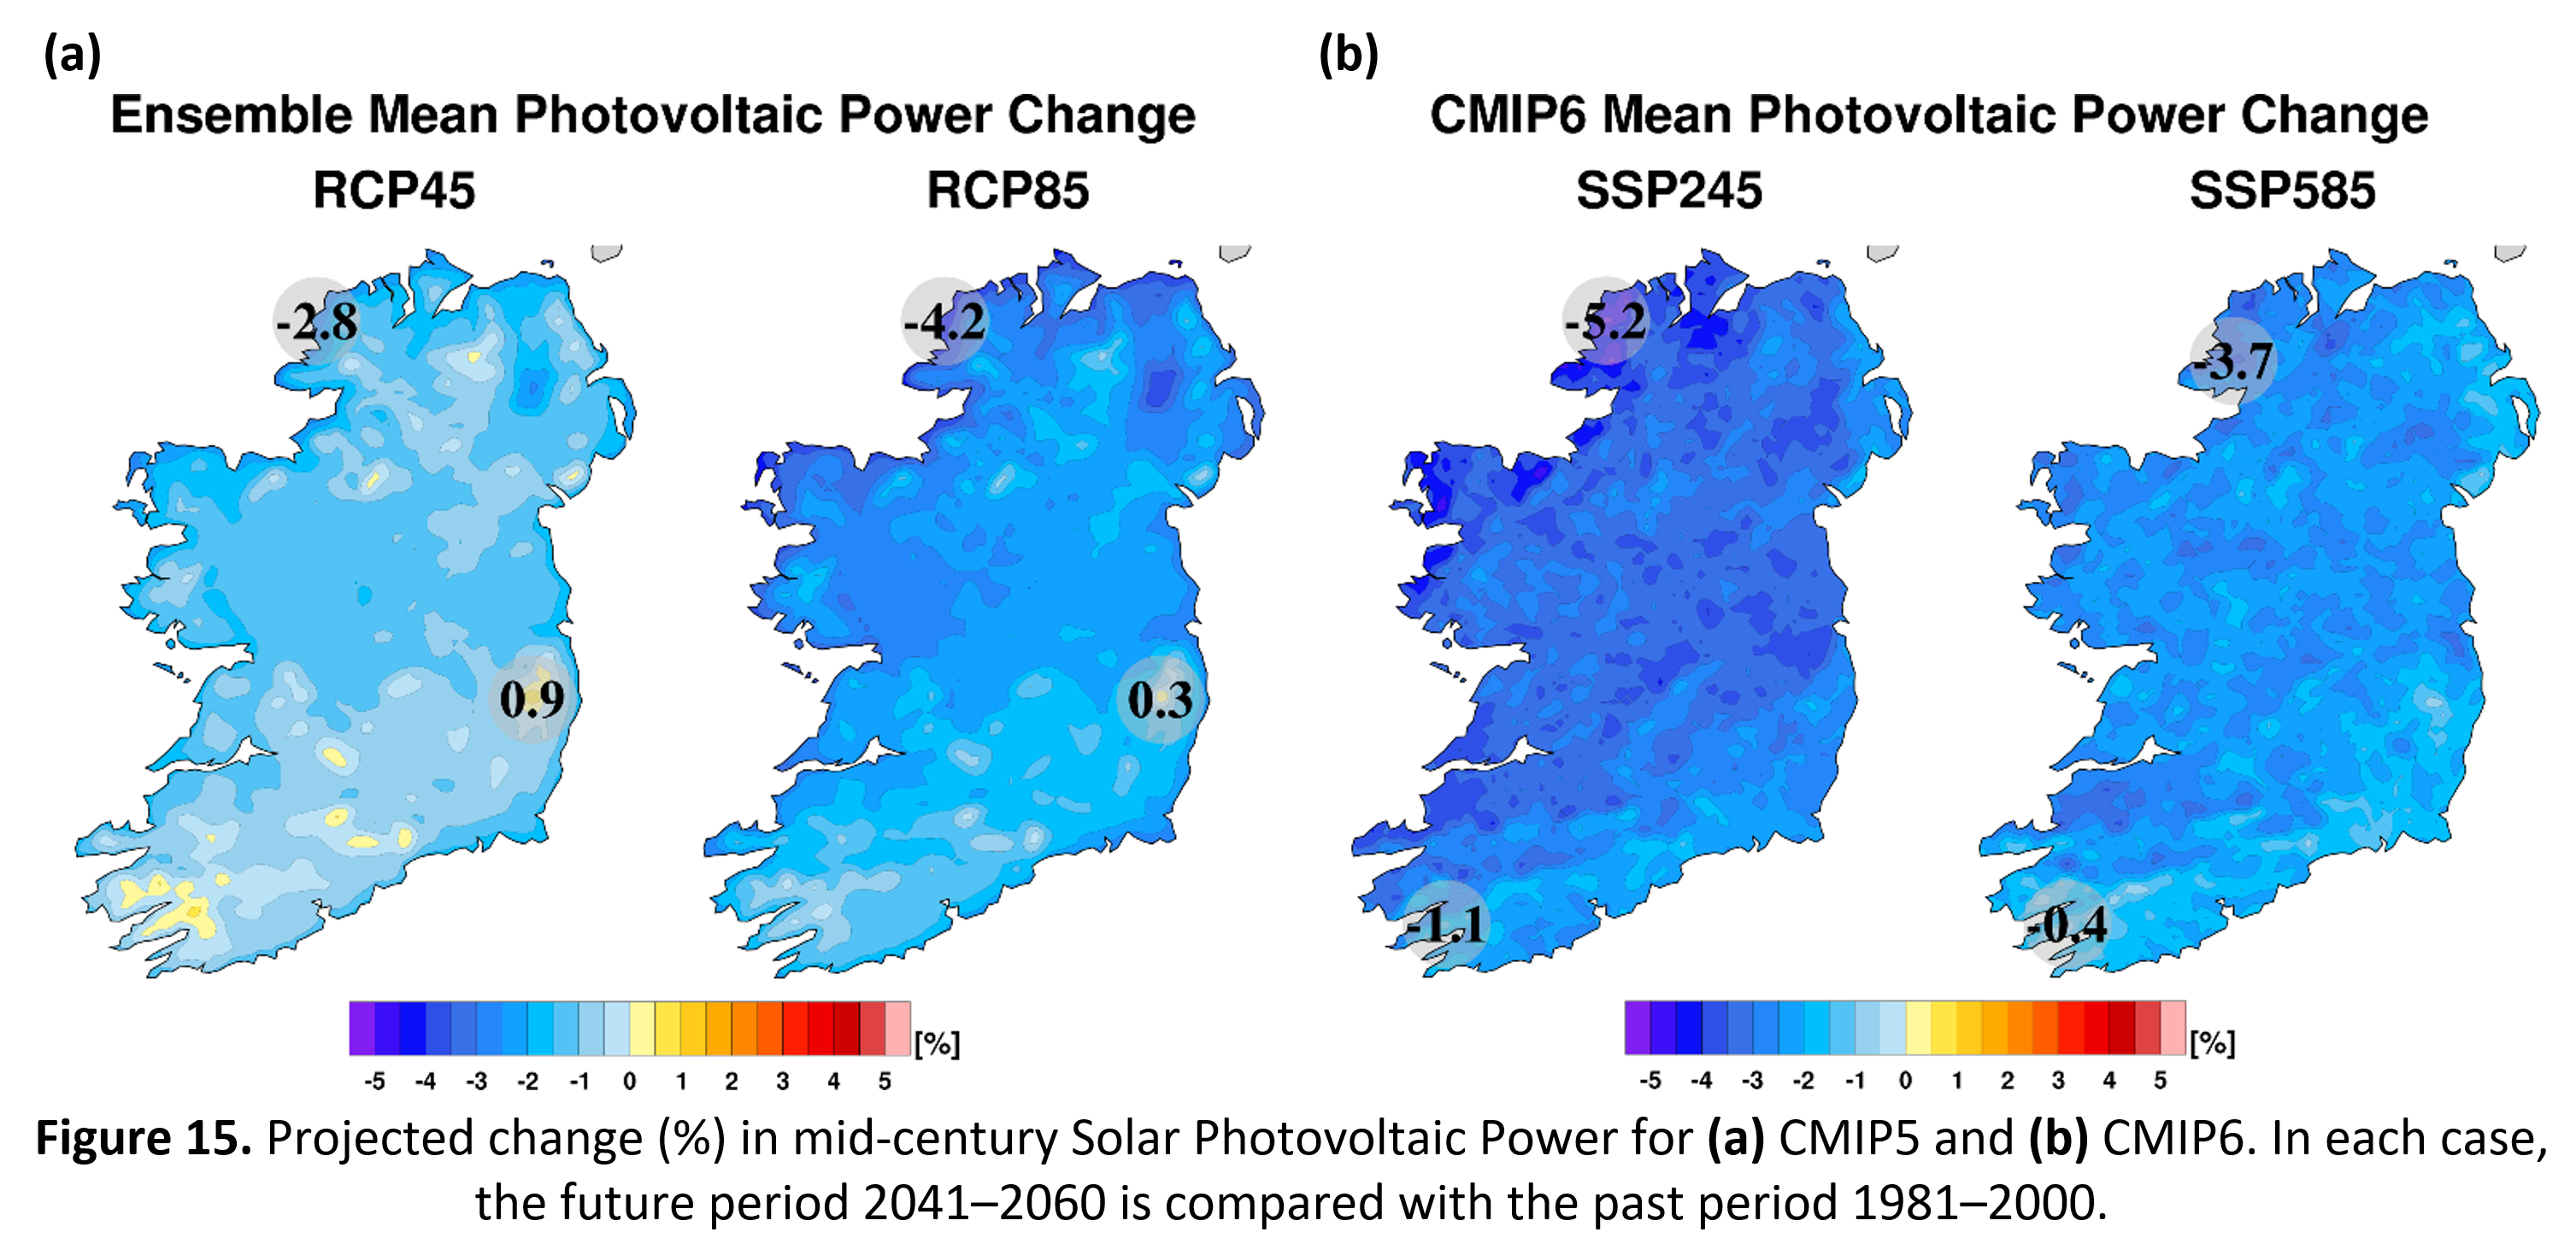
- The projected change in the solar photovoltaic (PV) energy resource, presented in Figure 15, shows a small expected decrease in PV by the middle of the century. The largest decreases are noted in the north of the country and for the RCP8.5 and SSP585 scenarios.
- Figure 16, the projected change in Heating Degree Days (HDDs), shows that by the middle of the century there will be a greatly reduced requirement for heating in Ireland. The HDDs were computed using a base temperature of 15.5°C (i.e., a mean daily temperate below which heating is required).
- The projections show that Cooling Degree Days (CDDs) are projected to slightly increase, particularly over the east and midlands, suggesting a small increase in air conditioning requirements by the middle of the century.
- Figure 17 shows that annual specific humidity (the amount of water vapour in the atmosphere calculated as the ratio of the mass of water vapour to the total mass of the air parcel) is projected to increase substantially by the middle of the century for both the RCP and SSP scenarios. There exists a clear south-west to north-east gradient in the projections, with the largest increases in the north.
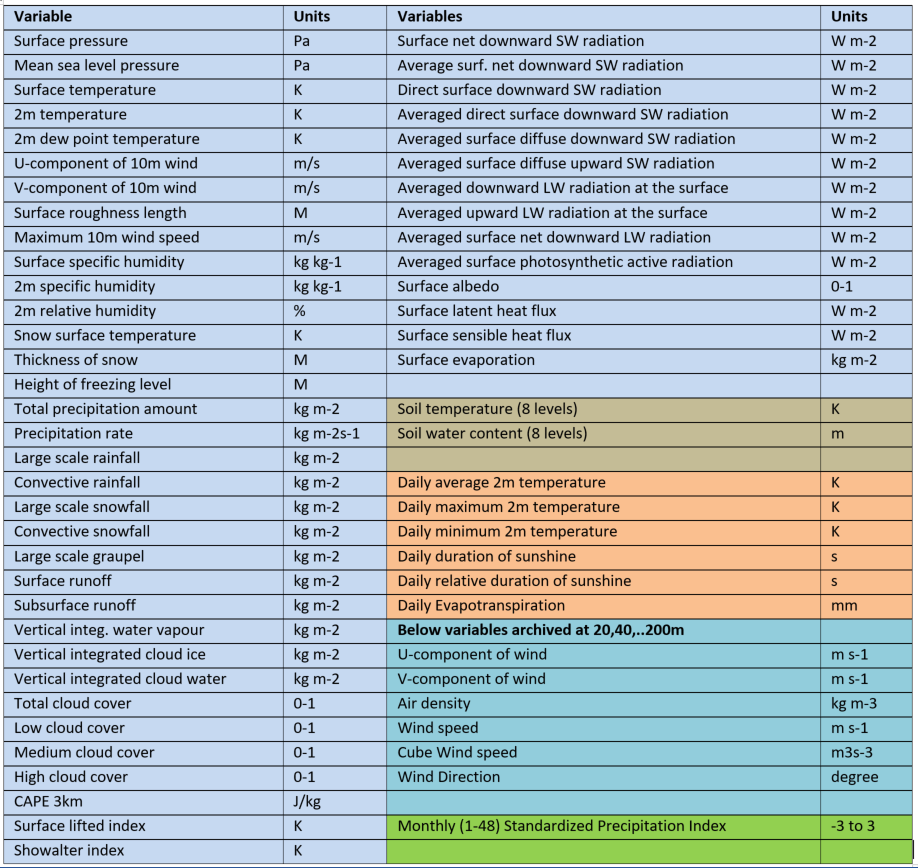
The PI will analyse projections of additional climate fields and derived variables that are of importance to sectors including agriculture, health, energy, biodiversity and transport. For reference, an overview of the archived RCM fields is presented in Table 2. We welcome suggestions from domain experts and policy makers on fields that are useful for specific areas of research. Please contact paul.nolan@ichec.ie and we will strive to produce projections of the requested field.


References
- Jones, C.D., J.E. Hickman, S.T. Rumbold, J. Walton, R.D. Lamboll, R.B. Skeie, S. Fiedler, P. Forster, J. Rogelj, M. Abe, M. Botzet, K. Calvin, C. Cassou, J.N.S. Cole, P. Davini, M. Deushi, M. Dix, J.C. Fyfe, N.P. Gillett, T. Ilyina, M. Kawamiya, M. Kelley, S. Kharin, T. Koshiro, H. Li, C. Mackallah, W.A. Müller, P. Nabat, T. van Noije, P. Nolan, R. Ohgaito, D. Olivié, N. Oshima, J. Parodi, T.J. Reerink, L. Ren, A. Romanou, R. Séférian, Y. Tang, C. Timmreck, J. Tjiputra, E. Tourigny, K. Tsigaridis, H. Wang, M. Wu, K. Wyser, S. Yang, Y. Yang, and T. Ziehn, 2021: The climate response to emissions reductions due to COVID19: Initial results from CovidMIP. Geophys. Res Lett., https://doi.org/10.1029/2020GL091883
- https://www.ichec.ie/news/climate-response-emissions-reductions-due-covid-19-initial-results-covid-model-intercomparison
- Nolan, P., Flanagan, J. (2020). High-Resolution Climate Projections for Ireland – A Multi-model Ensemble Approach. EPA Research Report, 339. http://epa.ie/pubs/reports/research/climate/researchreport339/
- https://www.ichec.ie/partnerships/state-supported/high-resolution-climate-projections-for-Ireland
- Paul Nolan, Alastair McKinstry (2020); EC-Earth Global Climate Simulations: Ireland’s Contributions to CMIP6. Environmental Protection Agency, Research Report 310. [Read].
- Döscher, R., Acosta, M., Alessandri, A., Anthoni, P., Arneth, A., Arsouze, T., Bergmann, T., Bernadello, R., Bousetta, S., Caron, L.-P., Carver, G., Castrillo, M., Catalano, F., Cvijanovic, I., Davini, P., Dekker, E., Doblas-Reyes, F. J., Docquier, D., Echevarria, P., Fladrich, U., Fuentes-Franco, R., Gröger, M., v. Hardenberg, J., Hieronymus, J., Karami, M. P., Keskinen, J.-P., Koenigk, T., Makkonen, R., Massonnet, F., Ménégoz, M., Miller, P. A., Moreno-Chamarro, E., Nieradzik, L., van Noije, T., Nolan, P., O’Donnell, D., Ollinaho, P., van den Oord, G., Ortega, P., Prims, O. T., Ramos, A., Reerink, T., Rousset, C., Ruprich-Robert, Y., Le Sager, P., Schmith, T., Schrödner, R., Serva, F., Sicardi, V., Sloth Madsen, M., Smith, B., Tian, T., Tourigny, E., Uotila, P., Vancoppenolle, M., Wang, S., Wårlind, D., Willén, U., Wyser, K., Yang, S., Yepes-Arbós, X., and Zhang, Q.: The EC-Earth3 Earth System Model for the Climate Model Intercomparison Project 6, Geosci. Model Dev. Discuss. [preprint], https://doi.org/10.5194/gmd-2020-446, 2021.
DISCLAIMER: Although every effort has been made to ensure the accuracy of the material contained in this website, complete accuracy cannot be guaranteed. Neither the Environmental Protection Agency nor the authors accept any responsibility whatsoever for loss or damage occasioned or claimed to have been occasioned, in part or in full, as a consequence of any person acting or refraining from acting, as a result of a matter contained in this website.
Partners